我想使用matplotlib从向量中绘制归一化直方图。我尝试了以下代码:
plt.hist(myarray, normed=True)
以及:
plt.hist(myarray, normed=1)
但是这两个选项都不能产生一个y轴从[0,1]开始的直方图,使得直方图的高度总和为1。
我想使用matplotlib从向量中绘制归一化直方图。我尝试了以下代码:
plt.hist(myarray, normed=True)
以及:
plt.hist(myarray, normed=1)
但是这两个选项都不能产生一个y轴从[0,1]开始的直方图,使得直方图的高度总和为1。
如果您希望所有条形图的总和等于1,请按值的总数加权每个箱子:
weights = np.ones_like(myarray) / len(myarray)
plt.hist(myarray, weights=weights)
Python 2.x版本需要在除法的运算符之一中添加float()进行强制类型转换,否则由于整数除法,你将得到零。
如果您能提供一个更完整的可运行示例(或在这种情况下是不工作的示例),将会更有帮助。
我尝试了以下内容:
import numpy as np
import matplotlib.pyplot as plt

x = np.random.randn(1000)

fig = plt.figure()
ax = fig.add_subplot(111)
n, bins, rectangles = ax.hist(x, 50, density=True)
fig.canvas.draw()
plt.show()
这确实会生成一个柱状直方图,y轴的范围为[0,1]。
此外,根据hist文档(即ipython中的ax.hist?),我认为总和也是可以的:
*normed*:
If *True*, the first element of the return tuple will
be the counts normalized to form a probability density, i.e.,
``n/(len(x)*dbin)``.  In a probability density, the integral of
the histogram should be 1; you can verify that with a
trapezoidal integration of the probability density function::

    pdf, bins, patches = ax.hist(...)
    print np.sum(pdf * np.diff(bins))
np.sum(n * np.diff(bins))
1.0。请记住,normed=True并不意味着每个柱子上的值之和为1,而是柱状图上积分为1。在我的情况下,np.sum(n)返回的是约为7.2767的值。import matplotlib.pyplot as plt
# Let X be the array whose histogram needs to be plotted.
nx, xbins, ptchs = plt.hist(X, bins=20)
plt.clf() # Get rid of this histogram since not the one we want.
nx_frac = nx/float(len(nx)) # Each bin divided by total number of objects.
width = xbins[1] - xbins[0] # Width of each bin.
x = np.ravel(zip(xbins[:-1], xbins[:-1]+width))
y = np.ravel(zip(nx_frac,nx_frac))
plt.plot(x,y,linestyle="dashed",label="MyLabel")
#... Further formatting.
这里是另一个使用np.histogram()方法的简单解决方案。
myarray = np.random.random(100)
results, edges = np.histogram(myarray, normed=True)
binWidth = edges[1] - edges[0]
plt.bar(edges[:-1], results*binWidth, binWidth)
你确实可以使用以下代码检查总和是否为1:
> print sum(results*binWidth)
1.0
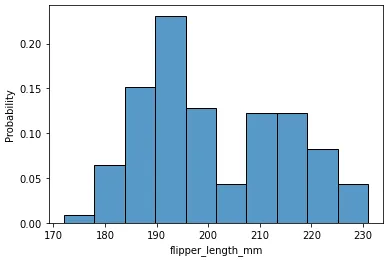
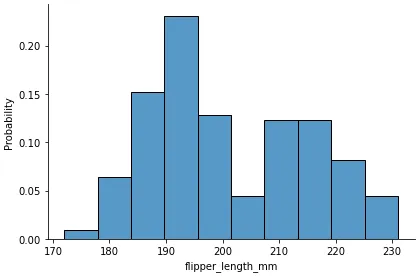
seaborn.histplot,或者使用 kind='hist' 的 seaborn.displot,并指定 stat='probability'
data: pandas.DataFrame, numpy.ndarray, 映射或序列seaborn 是 matplotlib 的高级 API
python 3.8.12、matplotlib 3.4.3、seaborn 0.11.2 中测试通过import seaborn as sns
import matplotlib.pyplot as plt
# load data
df = sns.load_dataset('penguins')
sns.histplot# create figure and axes
fig, ax = plt.subplots(figsize=(6, 5))
p = sns.histplot(data=df, x='flipper_length_mm', stat='probability', ax=ax)
sns.displotp = sns.displot(data=df, x='flipper_length_mm', stat='probability', height=4, aspect=1.5)
normed=True已被弃用。为了获得所需的输出,我不得不执行以下操作:import numpy as np
data=np.random.randn(1000)
bins=np.arange(-3.0,3.0,51)
counts, _ = np.histogram(data,bins=bins)
if density: # equivalent of normed=True
counts_weighter=counts.sum()
else: # equivalent of normed=False
counts_weighter=1.0
plt.hist(bins[:-1],bins=bins,weights=counts/counts_weighter)
plt.hist()的weights和density同时指定为参数并不起作用。如果有人知道在没有访问normed关键字参数的情况下使其工作的方法,请在评论中告诉我,我将删除/修改此答案。bins[:-1],它们是bin边缘-您需要选择一个适当的方案来计算中心(可能可以轻松推导,也可能不行)。
array_like而不是NumPy数组,则需要将len(myarray)转换为浮点数。 - cmh