有没有一种方法可以告诉matplotlib将直方图“规范化”,使其面积等于指定的值(而不是1)?
在中,选项“normed = 0”
n, bins, patches = plt.hist(x, 50, normed=0, histtype='stepfilled')
只是将其转化为频率分布。
有没有一种方法可以告诉matplotlib将直方图“规范化”,使其面积等于指定的值(而不是1)?
在中,选项“normed = 0”
n, bins, patches = plt.hist(x, 50, normed=0, histtype='stepfilled')
只是将其转化为频率分布。
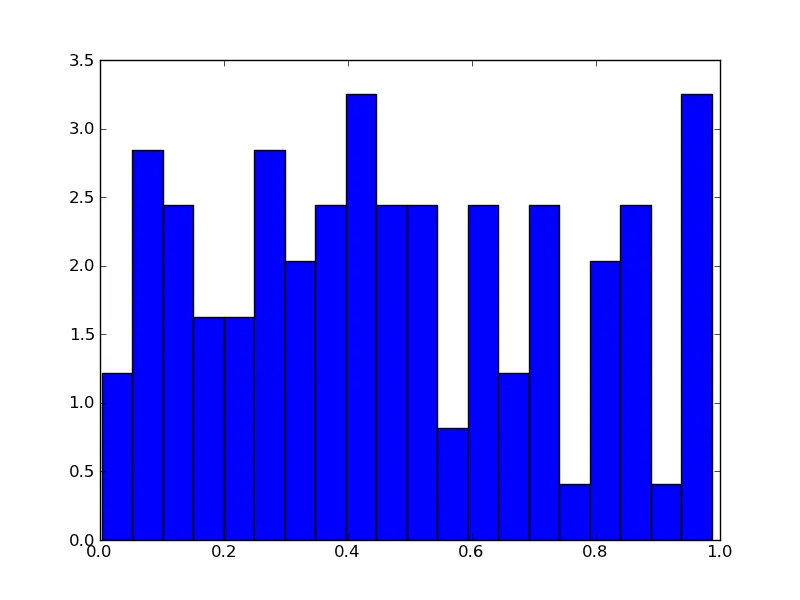
bar绘制直方图。normed_value。原始总和将不会是normed_value(尽管如果您愿意,很容易让它成为这种情况)。import numpy as np
import matplotlib.pyplot as plt
x = np.random.random(100)
normed_value = 2
hist, bins = np.histogram(x, bins=20, density=True)
widths = np.diff(bins)
hist *= normed_value
plt.bar(bins[:-1], hist, widths)
plt.show()
(hist * widths)。sum()将产生2.0)normed之外,将weights参数传递给hist。例如,如果您的区间为[minval, maxval],有n个区间,并且您想将面积归一化为A,那么我认为:weights = np.empty_like(x)
weights.fill(A * n / (maxval-minval) / x.size)
plt.hist(x, bins=n, range=(minval, maxval), weights=weights)
应该就这样搞定了。
编辑: weights 参数必须与 x 相同大小,并且其作用是使 x 中的每个值将对应的权值 in weights 贡献到 bin 计数中,而不是 1。
我认为 hist 函数可能需要更大的控制归一化的能力。例如,我认为就目前来说,在规定范围之外的值在规范化时被忽略,这通常不是您想要的。