import seaborn as sns
import matplotlib.pyplot as plt
dfw = sns.load_dataset("penguins", cache=False)[['bill_length_mm', 'bill_depth_mm']].dropna()
dfl = dfw.melt(var_name='bill_size', value_name='vals')
seaborn.displot
- 忽略
'sharex': False,但 'sharey' 可用
- 忽略
bins
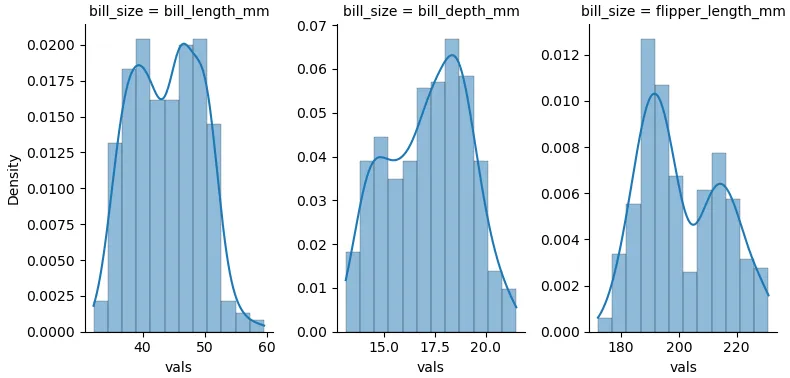
fg = sns.displot(data=dfl, x='vals', col='bill_size', kde=True, stat='density', bins=12, height=4, facet_kws={'sharey': False, 'sharex': False})
plt.show()
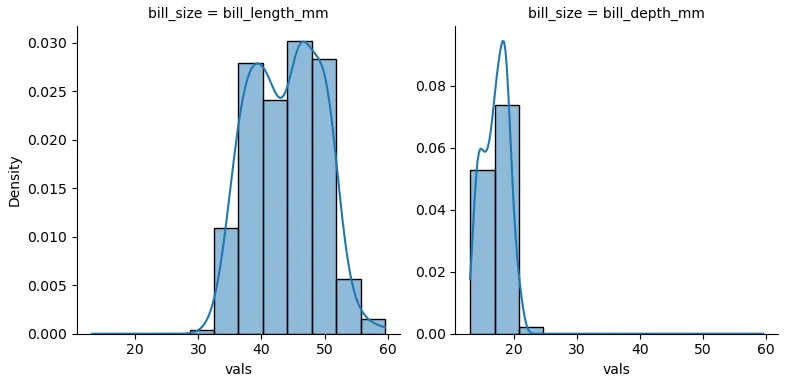
设置xlim没有任何影响。
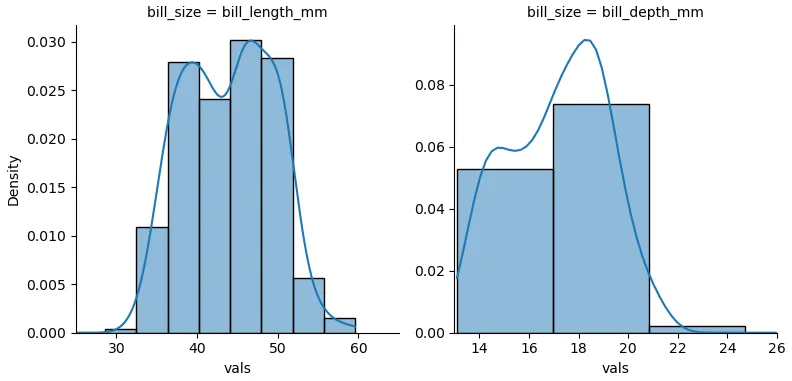
fg = sns.displot(data=dfl, x='vals', col='bill_size', kde=True, stat='density', bins=12, height=4, facet_kws={'sharey': False, 'sharex': False})
axes = fg.axes.ravel()
axes[0].set_xlim(25, 65)
axes[1].set_xlim(13, 26)
plt.show()
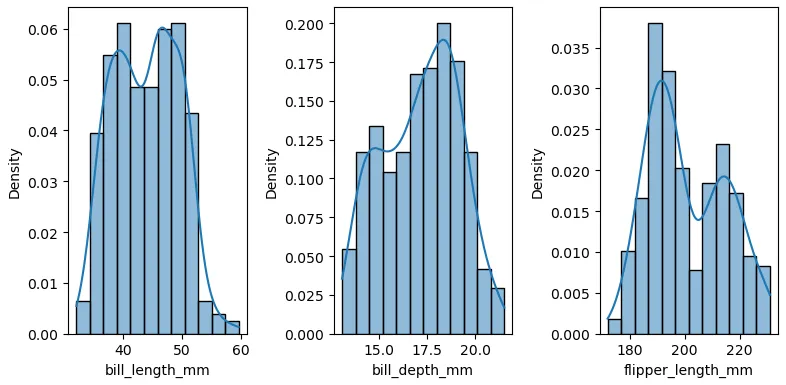
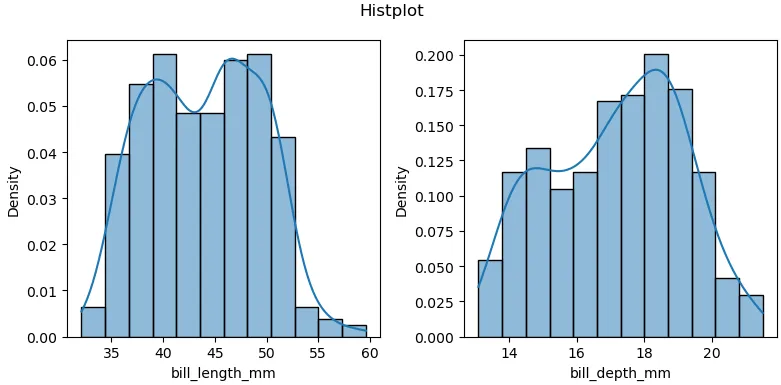
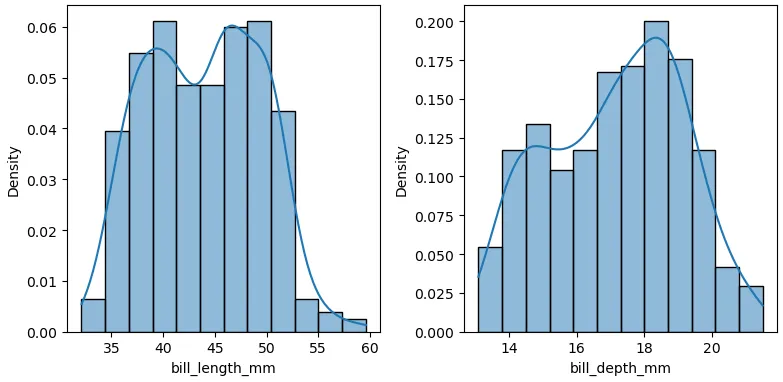
seaborn.histplot
fig, (ax1, ax2) = plt.subplots(1, 2, figsize=(8, 4))

sns.histplot(data=dfw.bill_length_mm, kde=True, stat='density', bins=12, ax=ax1)
sns.histplot(data=dfw.bill_depth_mm, kde=True, stat='density', bins=12, ax=ax2)
fig.tight_layout()
plt.show()
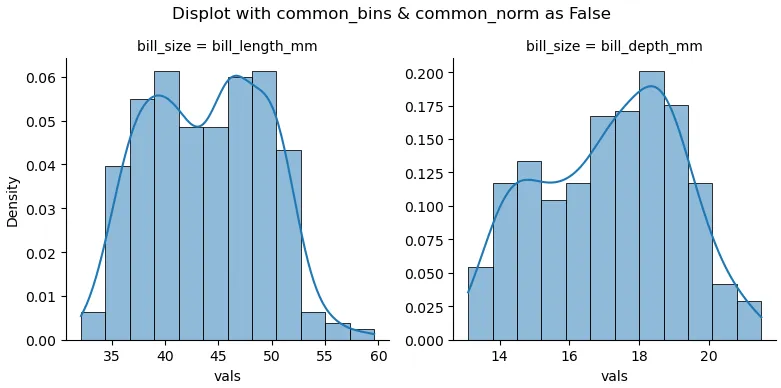
更新
- 根据mwaskom的建议,使用
common_bins=False可以使直方图形状相同,解决了忽略bins和sharex的问题。然而,在displot中的密度会受到绘图数量的影响。
- 如果在
displot中有3个图,则密度是histplot中显示密度的1/3;对于2个图,则密度为1/2。