问题陈述
我正在创建从1870年开始的每N年洪水事件分布图。我正在使用Pandas和Seaborn。我需要帮助来解决以下问题:
- 当使用
sns.displot时,指定每个bin的日期范围。 - 清晰地在x轴上表示我的bin大小规格。
为了澄清这个问题,这里是我正在使用的数据、我尝试过的方法以及所需输出的描述。
数据
我正在使用的数据可从美国气象服务处获取。
import pandas as pd
import bs4
import urllib.request
link = "https://water.weather.gov/ahps2/crests.php?wfo=jan&gage=jacm6&crest_type=historic"

webpage=str(urllib.request.urlopen(link).read())
soup = bs4.BeautifulSoup(webpage)

tbl = soup.find('div', class_='water_information')
vals = tbl.get_text().split(r'\n')

tcdf = pd.Series(vals).str.extractall(r'\((?P<Rank>\d+)\)\s(?P<Stage>\d+.\d+)\sft\son\s(?P<Date>\d{2}\/\d{2}\/\d{4})')\
    .reset_index(drop=True)

tcdf['Stage'] = tcdf.Stage.astype(float)
total_crests_events = len(tcdf)
tcdf['Rank'] = tcdf.Rank.astype(int)
tcdf['Date'] = pd.to_datetime(tcdf.Date)
有效方法
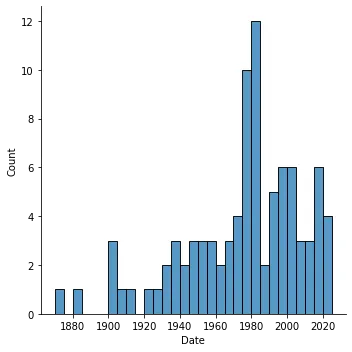
我可以使用Seaborn的displot绘制数据,并且可以使用bins命令来调整直方图中的柱子数量。
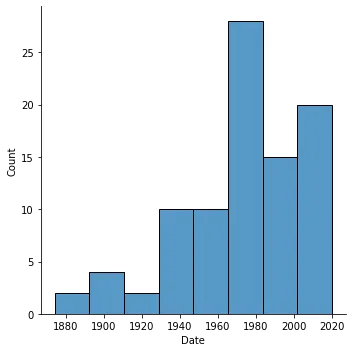
第二张图片更接近我想要的结果,但是我认为柱子的起始和结束位置不够清晰。例如,从左到右阅读的前两个柱明显在1880年之前开始并在之后结束,但具体的年份不清楚。
import seaborn as sns
# fig. 1: data distribution using default bin parameters
sns.displot(data=tcdf,x="Date")
# fig. 2: data distribution using 40 bins
sns.displot(data=tcdf,x="Date",bins=40)
出现的问题
我尝试使用 bins 参数指定日期范围,但是失败了。这种方法与之前的一个stackoverflow帖子有些相似。
my_bins = pd.date_range(start='1870',end='2025',freq='5YS')
sns.displot(data=tcdf,x="Date",bins=my_bins)
然而,这次尝试却产生了一个 TypeError 错误。
TypeError: Cannot cast array data from dtype('O') to dtype('float64') according to the rule 'safe'
这是一个比较长的问题,可能需要一些澄清。请在评论中随时提问,谢谢。