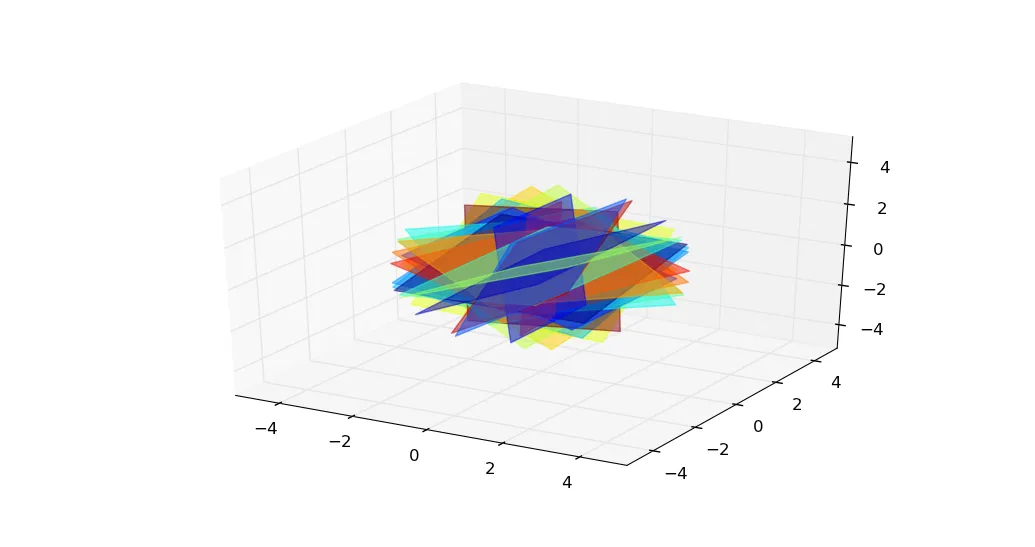
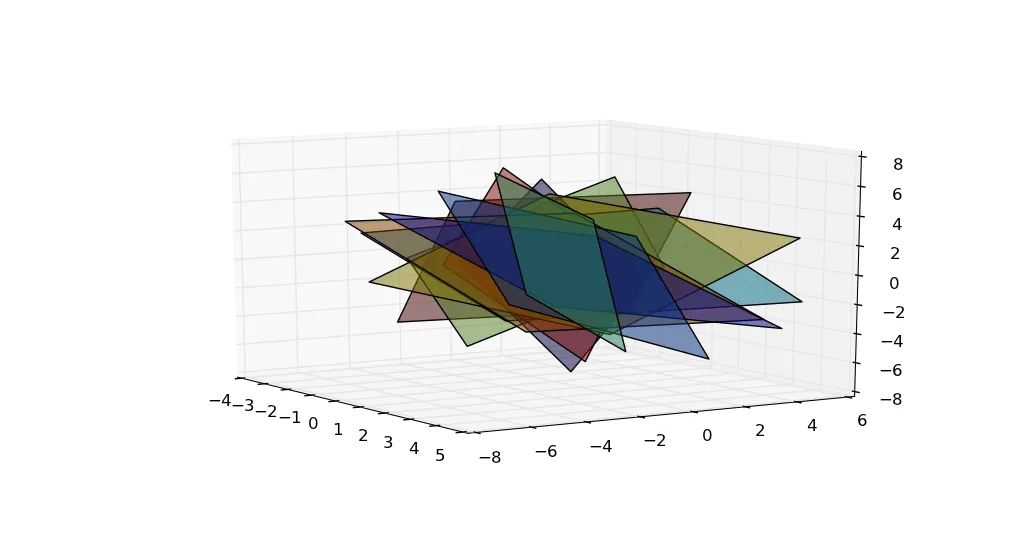
你的代码正在生成具有随机分布法线的平面。它们看起来不是那样,因为z轴比x轴和y轴大得多。
通过生成在平面上均匀分布的点,可以生成更好的外观图像。为此,使用新坐标(u,v)对平面进行参数化,然后在一致间隔的(u,v)点网格上对平面进行采样。然后将这些(u,v)点转换为(x,y,z)空间中的点。
from __future__ import division
import numpy as np
import matplotlib.pyplot as plt
from mpl_toolkits.mplot3d import Axes3D
import math
import itertools as IT
def points_on_sphere(dim, N, norm=np.random.normal):
"""
http://en.wikipedia.org/wiki/N-sphere#Generating_random_points
"""
normal_deviates = norm(size=(N, dim))
radius = np.sqrt((normal_deviates ** 2).sum(axis=0))
points = normal_deviates / radius
return points
n = 10
d = 3
fig, ax = plt.subplots(subplot_kw=dict(projection='3d'))
points = points_on_sphere(n, d).T
uu, vv = np.meshgrid([-5, 5], [-5, 5], sparse=True)
colors = np.linspace(0, 1, len(points))
cmap = plt.get_cmap('jet')
for nhat, c in IT.izip(points, colors):
u = (0, 1, 0) if np.allclose(nhat, (1, 0, 0)) else np.cross(nhat, (1, 0, 0))
u /= math.sqrt((u ** 2).sum())
v = np.cross(nhat, u)
u = u[:, np.newaxis, np.newaxis]
v = v[:, np.newaxis, np.newaxis]
xx, yy, zz = u * uu + v * vv
ax.plot_surface(xx, yy, zz, alpha=0.5, color=cmap(c))
ax.set_xlim3d([-5,5])
ax.set_ylim3d([-5,5])
ax.set_zlim3d([-5,5])
plt.show()
或者,您可以使用Till Hoffmann的pathpatch_2d_to_3d实用程序函数来避免复杂的数学计算:
for nhat, c in IT.izip(points, colors):
    p = patches.Rectangle((-2.5, -2.5), 5, 5, color=cmap(c), alpha=0.5)
    ax.add_patch(p)
    pathpatch_2d_to_3d(p, z=0, normal=nhat)

ax.set_xlim3d([-5,5])
ax.set_ylim3d([-5,5])
ax.set_zlim3d([-5,5])
plt.show()