同时绘制三维平面和点。

43
我正在尝试使用Matplotlib在3D中同时绘制平面和一些点。
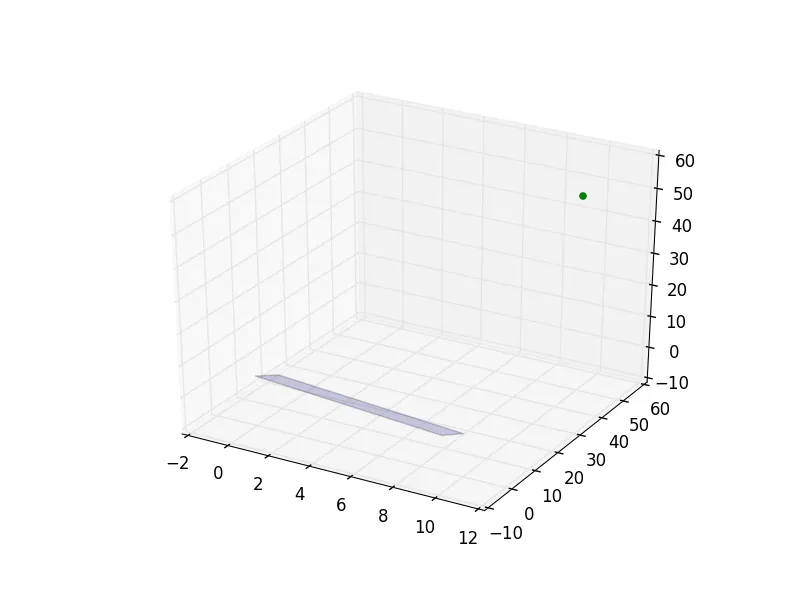
 我没有错误,只是点不会出现。 我可以在不同的时间绘制一些点和平面,但从未同时绘制。 代码的部分如下:
import numpy as np
import matplotlib.pyplot as plt
from mpl_toolkits.mplot3d import Axes3D

point  = np.array([1, 2, 3])
normal = np.array([1, 1, 2])

point2 = np.array([10, 50, 50])

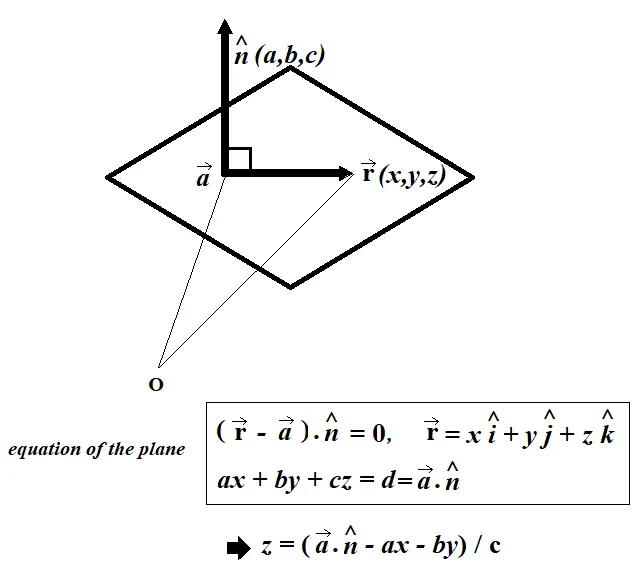
# a plane is a*x+b*y+c*z+d=0
# [a,b,c] is the normal. Thus, we have to calculate
# d and we're set
d = -point.dot(normal)

# create x,y
xx, yy = np.meshgrid(range(10), range(10))

# calculate corresponding z
z = (-normal[0] * xx - normal[1] * yy - d) * 1. /normal[2]
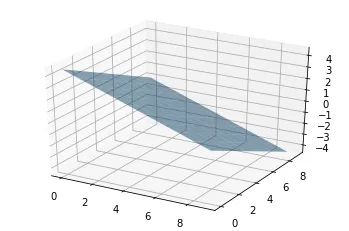
# plot the surface
plt3d = plt.figure().gca(projection='3d')
plt3d.plot_surface(xx, yy, z, alpha=0.2)


#and i would like to plot this point : 
ax.scatter(point2[0] , point2[1] , point2[2],  color='green')

plt.show()

@ AndreyRubshtein 这个有什么关系吗?你提供的链接是关于 matlab 的,而这个问题是关于 matplotlib 的。 - tmdavison
嘿@tom,这里有一个关于数学公式的解释,原问题中称为“计算相应的z”。 - Andrey Rubshtein
好的,虽然这不是这个问题和答案的主题。 - tmdavison
1
仅提一下:该方法对于具有z分量等于零的法向量将失败!因此,例如,normal = np.array([1,0,0])将抛出RuntimeWarning: divide by zero encountered in true_divide,并且没有平面被绘制! - Douglas James Bock
3个回答

28

只是为了补充@suever的答案,你可以创建Axes,然后在其上绘制表面和散点。这样就没有必要使用ax.hold()了。

# Create the figure
fig = plt.figure()

# Add an axes
ax = fig.add_subplot(111,projection='3d')

# plot the surface
ax.plot_surface(xx, yy, z, alpha=0.2)

# and plot the point 
ax.scatter(point2[0] , point2[1] , point2[2],  color='green')

21

您需要告诉轴,您希望新图表“添加”到当前轴上的绘图而不是覆盖它们。为此,您需要使用axes.hold(True)

# plot the surface
plt3d = plt.figure().gca(projection='3d')
plt3d.plot_surface(xx, yy, z, alpha=0.2)

# Ensure that the next plot doesn't overwrite the first plot
ax = plt.gca()
ax.hold(True)

ax.scatter(points2[0], point2[1], point2[2], color='green')

这里输入图像描述

更新

正如@tcaswell在评论中指出的那样,他们正在考虑停止支持hold。因此,更好的方法可能是直接使用轴添加更多的绘图,就像@tom's answer中所示。


你日常实际使用 hold 吗?我们一直在讨论弃用它,我想和一个真正使用它的人谈谈... - tacaswell
@tcaswell 我倾向于这样做,但我认为这主要是由于我使用MATLAB时养成的习惯。话虽如此,我实际上很喜欢Tom提到的另一种方法,但我从来没有想过使用它! - Suever
另外,我认为大多数情况下默认值为 hold==True。如果你发现一个使用案例无法仅仅删除它,请在 GH 上提出问题。 - tacaswell
属性错误:'Axes3D' 对象没有 'hold' 属性。 - Mona Jalal

9

稍微详细解释一下数学部分(以及它是如何工作的),可能对某些人有用,包含点a的单位法向量n的平面方程如下所示:

enter image description here

因此,这里的平面方程为 x+y+2*z=9,以下代码可用于绘制给定的平面:

# create the figure
fig = plt.figure()

# add axes
ax = fig.add_subplot(111,projection='3d')

xx, yy = np.meshgrid(range(10), range(10))
z = (9 - xx - yy) / 2 

# plot the plane
ax.plot_surface(xx, yy, z, alpha=0.5)

plt.show()

enter image description here

使用scatter()轻松绘制点。

网页内容由stack overflow 提供, 点击上面的
可以查看英文原文,
原文链接