绘制平面法向量

4

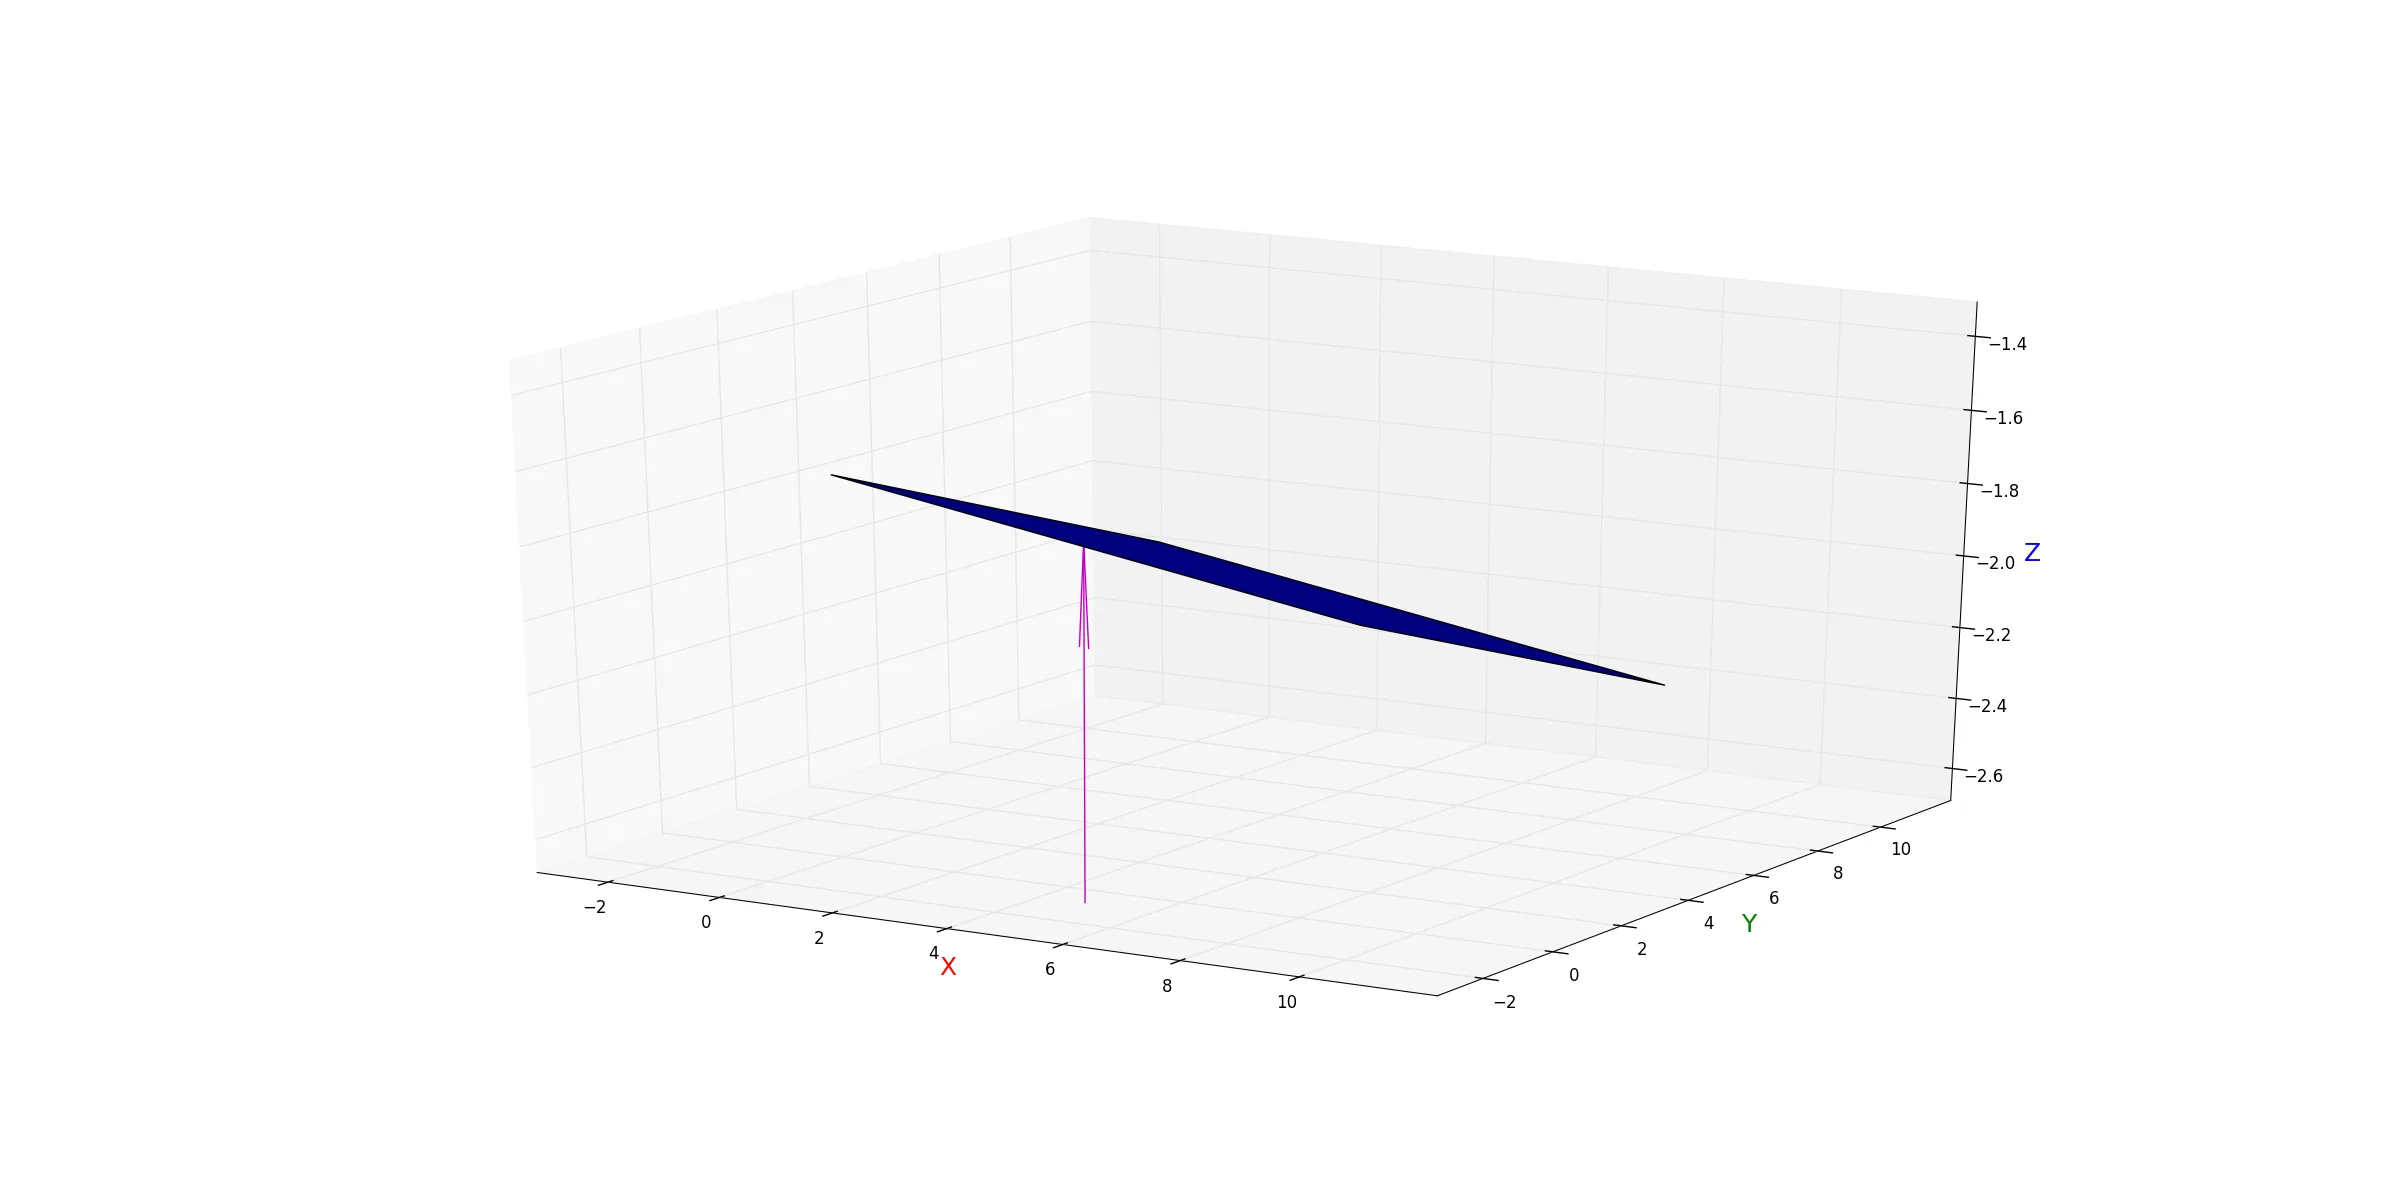
法向量是通过平面上两个向量的叉积计算得出的,因此应该垂直于平面。但是从图中可以看出,用quiver产生的法向量不垂直。 是平面计算有误,还是我的法向量或绘制法向量的方法有误?

import numpy as np
import matplotlib.pyplot as plt
from mpl_toolkits.mplot3d import Axes3D

points = [[3.2342, 1.8487, -1.8186],
           [2.9829, 1.6434, -1.8019],
           [3.4247, 1.5550, -1.8093]]

p0, p1, p2 = points
x0, y0, z0 = p0
x1, y1, z1 = p1
x2, y2, z2 = p2

ux, uy, uz = u = [x1-x0, y1-y0, z1-z0] #first vector
vx, vy, vz = v = [x2-x0, y2-y0, z2-z0] #sec vector

u_cross_v = [uy*vz-uz*vy, uz*vx-ux*vz, ux*vy-uy*vx] #cross product

point  = np.array(p1)
normal = np.array(u_cross_v)

d = -point.dot(normal)

print('plane equation:\n{:1.4f}x + {:1.4f}y + {:1.4f}z + {:1.4f} = 0'.format(normal[0], normal[1], normal[2], d))

xx, yy = np.meshgrid(range(10), range(10))

z = (-normal[0] * xx - normal[1] * yy - d) * 1. / normal[2]

# plot the surface
plt3d = plt.figure().gca(projection='3d')
plt3d.quiver(x0, y0, z0, normal[0], normal[1], normal[2], color="m")

plt3d.plot_surface(xx, yy, z)

plt3d.set_xlabel("X", color='red', size=18)
plt3d.set_ylabel("Y", color='green', size=18)
plt3d.set_zlabel("Z", color='b', size=18)
plt.show()

enter image description here


那个问题解决了吗? - Dorian
@Dorian 不,它很有帮助,但它仍然看起来不垂直。我只需要可视化来验证我的代码(计算一些点到平面的距离)。现在我确定计算是正确的,即使我无法正确地可视化它。 - campy
不确定你是否理解正确,但那是正确的解决方案。你的平面与XY平面非常对齐。如果选择其他参数,你会看到不同的结果。 - Dorian
1个回答

3

实际上,您的图表是100%正确的。 您Z轴的刻度尺并不对应于X&Y轴上的相同刻度尺。 如果您使用一个函数来设置比例正确,您会看到:

...
plt3d.set_zlabel("Z", color='b', size=18)

# insert these lines
ax = plt.gca()
set_axis_equal(ax)

plt.show()

以及从这篇帖子中相应的函数:

def set_axes_radius(ax, origin, radius):
    '''
        From StackOverflow question:
        https://dev59.com/oGYr5IYBdhLWcg3wb5rc
    '''
    ax.set_xlim3d([origin[0] - radius, origin[0] + radius])
    ax.set_ylim3d([origin[1] - radius, origin[1] + radius])
    ax.set_zlim3d([origin[2] - radius, origin[2] + radius])


def set_axes_equal(ax, zoom=1.):
    '''
        Make axes of 3D plot have equal scale so that spheres appear as spheres,
        cubes as cubes, etc..  This is one possible solution to Matplotlib's
        ax.set_aspect("equal") and ax.axis("equal") not working for 3D.
        input:
          ax:   a matplotlib axis, e.g., as output from plt.gca().

    '''

    limits = np.array([
        ax.get_xlim3d(),
        ax.get_ylim3d(),
        ax.get_zlim3d(),
    ])

    origin = np.mean(limits, axis=1)
    radius = 0.5 * np.max(np.abs(limits[:, 1] - limits[:, 0])) / zoom
    set_axes_radius(ax, origin, radius)

网页内容由stack overflow 提供, 点击上面的
可以查看英文原文,
原文链接