如何在Python中绘制超平面支持向量机?

3

这是我的第一个问题,请耐心等待 :)

我使用Shogun工具箱在Python中处理SVM。我首先进行试验以更好地理解SVM。我用一些数据点编写了一些代码来线性分离。我使用LibSVM()

X = np.array([[2.0,  2.0, 1.0, 1.0],               
              [1.0, -1.0, 1.0, -1.0]])

Y = np.array([[4.0, 5.0,  5.0, 4.0],
              [1.0, 1.0, -1.0, -1.0]])

样本数据点

在使用给定的数据训练SVM后,我可以获取它的偏差(get_bias()),支持向量(get_support_vectors())和其他属性。但我无法绘制出直线/超平面。我知道超平面的方程是y=wx + b,但如何编写/绘制它以在我的图中查看。

2个回答

1

完整示例:

enter image description here

import numpy as np
import matplotlib.pyplot as plt

def __intersect(rect, line):
    l = []
    xmin,xmax,ymin,ymax = rect
    a,b,c = line

    assert a!=0 or b!=0

    if a == 0:
        y = -c/b
        if y<=ymax and y>=ymin:
            l.append((xmin, y))
            l.append((xmax, y))
        return l
    if b == 0:
        x = -c/a
        if x<=xmax and x>=xmin:
            l.append((x, ymin))
            l.append((x, ymax))
        return l

    k = -a/b
    m = -c/b
    for x in (xmin, xmax):
        y = k*x+m
        if y<=ymax and y>= ymin:
            l.append((x,y))

    k = -b/a
    m = -c/a
    for y in (ymin, ymax):
        x = k*y+m
        if x<xmax and x> xmin:
            l.append((x,y))
    return l


def plotline(coef, *args, **kwargs):
    '''plot line: y=a*x+b or a*x+b*y+c=0'''
    coef = np.float64(coef[:])
    assert len(coef)==2 or len(coef)==3
    if len(coef) == 2:
        a, b, c = coef[0], -1., coef[1]
    elif len(coef) == 3:
        a, b, c = coef
    ax = plt.gca()

    limits = ax.axis()
    points = __intersect(limits, (a,b,c))
    if len(points) == 2:
        pts = np.array(points)
        ax.plot(pts[:,0], pts[:,1], *args, **kwargs)
        ax.axis(limits)

def circle_out(x, y, s=20, *args, **kwargs):
    '''Circle out points with size 's' and edgecolors'''
    ax = plt.gca()
    if 'edgecolors' not in kwargs:
        kwargs['edgecolors'] = 'g'
    ax.scatter(x, y, s, facecolors='none', *args, **kwargs)


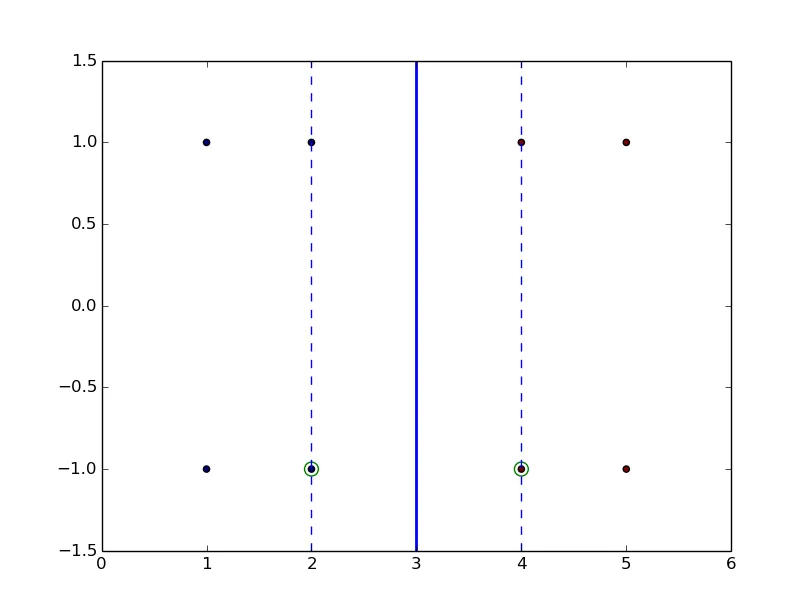
def plotSVM(coef, support_vectors=None):
    coef1 = coef[:]
    coef2 = coef[:]
    coef1[2] += 1 
    coef2[2] -= 1
    plotline(coef, 'b', lw=2)
    plotline(coef1, 'b', ls='dashed')
    plotline(coef2, 'b', ls='dashed')

    if support_vectors != None:
        circle_out(support_vectors[:,0], support_vectors[:,1], s=100)


from pylab import *

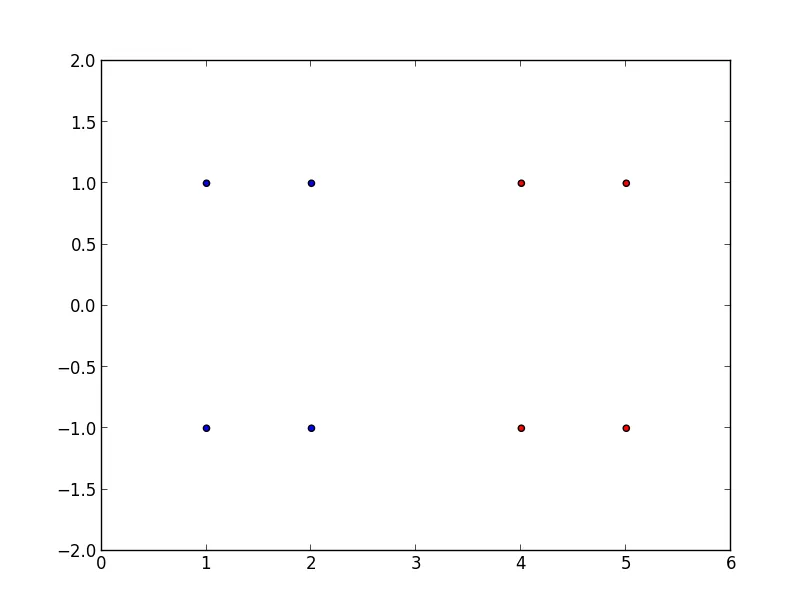
X = array([[2.0,  2.0, 1.0, 1.0],               
              [1.0, -1.0, 1.0, -1.0]])

Y = array([[4.0, 5.0,  5.0, 4.0],
              [1.0, 1.0, -1.0, -1.0]])

data = hstack((X,Y)).T
label = hstack((zeros(X.shape[1]), ones(Y.shape[1])))

from sklearn.svm import SVC

clf = SVC(kernel='linear')
clf.fit(data, label)

coef = [clf.coef_[0,0], clf.coef_[0,1], clf.intercept_[0]]
scatter(data[:,0], data[:,1], c=label)
plotSVM(coef, clf.support_vectors_)
show()

首先,感谢您提供的完整示例。但是,该实现是使用sklearn完成的,而我正在使用shogun并使用类LibSVM。因此,我查看了给定的示例,但无法确定clf.coef_在LibSVM属性方面的含义。 训练后,我们有alphas libsvm.get_alphas(),可以通过sum(alpha*label*support_vector)获取w。 如果我第一次没有表达清楚,我很抱歉,但我真的尝试通过复制数字/向量等来理解SVM。 - Hamza
所以我的问题是:如何使用shogun绘制超平面 :) - Hamza
这是一个很好的示例代码...我很好奇为什么您使用hstack函数作为hstack数组的输出,以及0/1数组可以直接设置为SVC的参数。 - NoBugs

0
from pylab import *

def __intersect(rect, line):
    l = []
    xmin,xmax,ymin,ymax = rect
    a,b,c = line

    assert a!=0 or b!=0

    if a == 0:
        y = -c/b
        if y<=ymax and y>=ymin:
            l.append((xmin, y))
            l.append((xmax, y))
        return l
    if b == 0:
        x = -c/a
        if x<=xmax and x>=xmin:
            l.append((x, ymin))
            l.append((x, ymax))
        return l

    k = -a/b
    m = -c/b
    for x in (xmin, xmax):
        y = k*x+m
        if y<=ymax and y>= ymin:
            l.append((x,y))

    k = -b/a
    m = -c/a
    for y in (ymin, ymax):
        x = k*y+m
        if x<=xmax and y>= xmin and len(l) < 2:
            l.append((x,y))
    return l


def plotLine(coef, *args, **kwargs):
    '''plot line: y=a*x+b or a*x+b*y+c=0'''
    coef = float64(coef[:])
    assert len(coef)==2 or len(coef)==3
    if len(coef) == 2:
        a, b, c = coef[0], -1., coef[1]
    elif len(coef) == 3:
        a, b, c = coef
    ax = gca()

    limits = ax.axis()
    print limits
    points = __intersect(limits, (a,b,c))
    print points
    if len(points) == 2:
        pts = array(points)
        ax.plot(pts[:,0], pts[:,1], *args, **kwargs)
        ax.axis(limits)

抱歉,我不理解。在你的答案中,你在哪里使用SVM的任何结果来绘制超平面? - Hamza

网页内容由stack overflow 提供, 点击上面的
可以查看英文原文,
原文链接