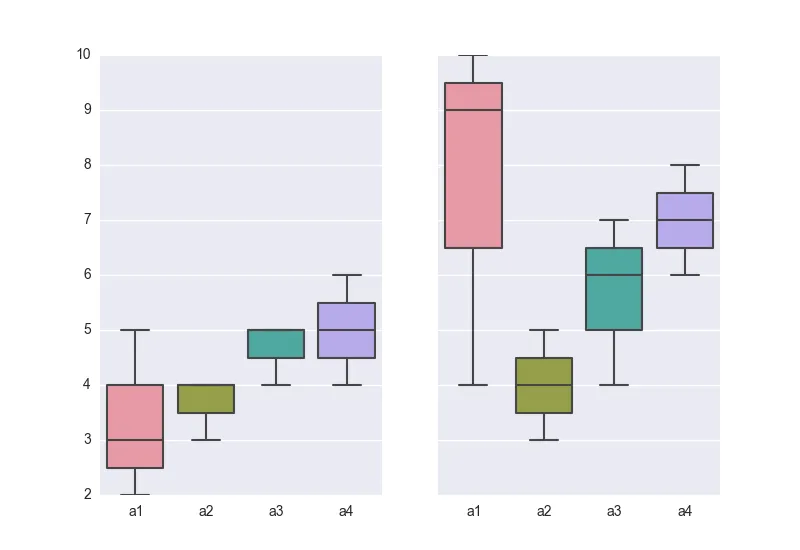
这并没有为这个对话增加太多内容,但是我在处理这个问题上挣扎了比应该更长的时间(实际集群无法使用),所以我想将我的实现作为另一个示例添加进来。它有一个叠加的散点图(因为我的数据集非常麻烦),使用索引显示融合,并进行了一些美学调整。希望对某人有用。
output_graph
这是不使用列标题的版本(我看到一个不同的线程想知道如何使用索引来做到这一点):
combined_array: ndarray = np.concatenate([dbscan_output.data, dbscan_output.labels.reshape(-1, 1)], axis=1)
cluster_data_df: DataFrame = DataFrame(combined_array)
if you want to use labelled columns:
column_names: List[str] = list(outcome_variable_names)
column_names.append('cluster')
cluster_data_df.set_axis(column_names, axis='columns', inplace=True)
graph_data: DataFrame = pd.melt(
frame=cluster_data_df,
id_vars=['cluster'],
var_name='psychometric_test',
value_name='standard deviations from the mean'
)
生成的数据框(行数 = 样本数 x 变量数(在我的情况下为1626 x 6 = 9756)):
| 索引 |
聚类 |
心理测量测试 |
标准差距平均值 |
| 0 |
0.0 |
结果变量1 |
-1.276182 |
| 1 |
0.0 |
结果变量1 |
-1.118813 |
| 2 |
0.0 |
结果变量1 |
-1.276182 |
| 9754 |
0.0 |
结果变量6 |
0.892548 |
| 9755 |
0.0 |
结果变量6 |
1.420480 |
如果要在melt中使用索引:
graph_data: DataFrame = pd.melt(
    frame=cluster_data_df,
    id_vars=cluster_data_df.columns[-1],
    # value_vars=cluster_data_df.columns[:-1],
    var_name='psychometric_test',
    value_name='standard deviations from the mean'
)
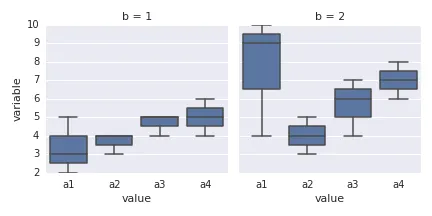
这是绘图代码:
(使用列标题完成 - 请注意,y轴=值名称,x轴=变量名称,hue=id_vars):
sns.set_theme(style="ticks")
fig = plt.figure(figsize=(10, 10))
fig.set(font_scale=1.2)
fig.set_style("white")
fig.ax = sns.boxplot(y='standard deviations from the mean', x='psychometric_test', hue='cluster', showfliers=False,
data=graph_data)
for patch in fig.ax.artists:
r, g, b, a = patch.get_facecolor()
patch.set_facecolor((r, g, b, .2))
fig.ax = sns.stripplot(y='standard deviations from the mean', x='psychometric_test', hue='cluster', data=graph_data,
dodge=True, alpha=.25, zorder=1)
cluster_n: int = dbscan_output.n_clusters
i = 0
cluster_info: Dict[int, int] = dbscan_output.cluster_sizes
legend_labels: List[str] = []
while i < cluster_n:
label: str = f"cluster {i+1}, n = {cluster_info[i]}"
legend_labels.append(label)
i += 1
if -1 in cluster_info.keys():
cluster_n += 1
label: str = f"Unclustered, n = {cluster_info[-1]}"
legend_labels.insert(0, label)
handles, labels = fig.ax.get_legend_handles_labels()
index: int = int(cluster_n*(-1))
labels = legend_labels
plt.legend(handles[index:], labels[0:])
plt.xticks(rotation=45)
plt.show()
asds
注意:我的大部分时间都花在调试melt函数上。我主要遇到了错误"*只有整数标量数组可以通过1D numpy索引数组转换为标量索引*"。我的输出需要将结果变量值表和聚类(DBSCAN)连接起来,我在concat方法中给聚类数组加了额外的方括号。因此,我有一列每个值都是一个不可见的List[int],而不是一个普通的int。这很狭窄,但也许能帮助某些人。
- 列表项
sns.boxplot已经可以绘制嵌套箱线图。这篇帖子偶尔会收到点赞。 - mwaskommelt真是疯狂和超级出乎意料的。 - seralouk