我正在使用Seaborn从Pandas数据框中制作箱线图。
colorpalette = sns.hls_palette(8,h=.9)
g = sns.boxplot(x="estimator", y="mean_score", data=dFrame, palette=colorpalette)

g.set(ylabel='Mean Accuracy', xlabel='')
plt.show()
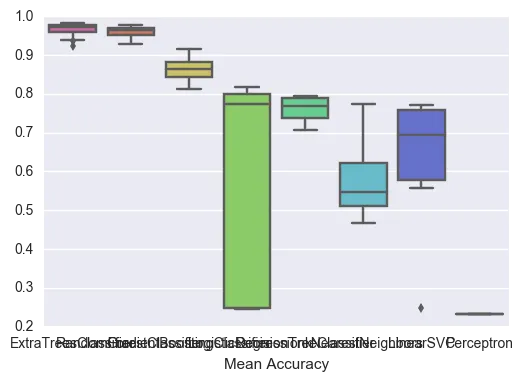
这是我之前的一个结果。如您所见,刻度标签太长不能在一行中呈现。因此,我打算在xticklabels上使用textwrap将它们跨越多行展示。为了获取这些标签,我尝试使用:
g.xaxis.get_ticklabels()
返回以下内容
<a list of 9 Text major ticklabel objects>
如果我像这样在循环中尝试它
for item in g.xaxis.get_ticklabels():
    print(item)
我获得了以下输出
Text(0,0,'ExtraTreesClassifier')
Text(1,0,'RandomForestClassifier')
Text(2,0,'GradientBoostingClassifier')
Text(3,0,'LogisticRegression')
Text(4,0,'DecisionTreeClassifier')
Text(5,0,'kNearestNeighbors')
Text(6,0,'LinearSVC')
Text(7,0,'Perceptron')
是否有一种使用Seaborn默认函数/方法更有效率的方法呢?
import textwrap。 - Archie