我想在一些图表中添加水平线,即“目标”线:条纹图、箱线图和小提琴图,以显示理想值数据(或理想范围)。这个R示例(Add multiple horizontal lines in a boxplot)-第一张图片-基本上就是它(尽管我会进行一些格式化使其更具可读性)。 R abline() equivalent in Python对我没有帮助(或者我还没有弄清楚如何使用),因为我正在使用分类数据,所以我只想基本定义(例如)
任何帮助都非常感激。
y=3并绘制它。我的代码(如下)运行良好,我只是不知道如何添加一条线。fig, ax = plt.subplots(nrows=4,figsize=(20,20))
sns.violinplot(x="Wafer", y="Means", hue='Feature',
data=Means[Means.Target == 1], ax=ax[0])
sns.violinplot(x="Wafer", y="Means", hue='Feature',
data=Means[Means.Target == 3], ax=ax[1])
sns.boxplot(x="Feature", y="Means",
data=Means, linewidth=0.8, ax=ax[2])
sns.stripplot(x="Feature", y="Means", hue='Wafer',
data=Means, palette="plasma", jitter=0.1, size=5.5, ax=ax[3])
任何帮助都非常感激。
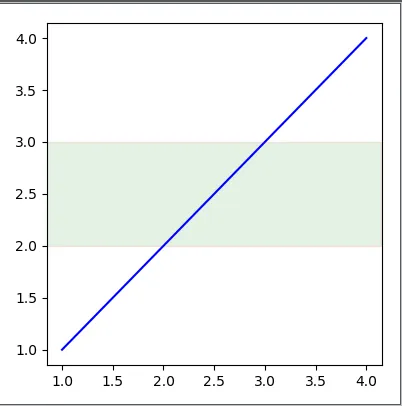
plt.hlines(y, xmin, xmax)。 - Sheldore