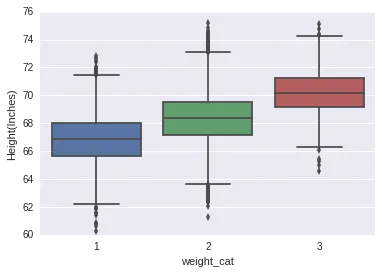
我希望绘制三个箱线图,分别对应1、2和3的
因此,我有这样一个数据框:
下面的代码最终占用了我所有的内存。我认为这不正常:
这里有什么问题吗?这是手册的链接。数据框的形状为(25000, 4)。这是csv文件的链接。
以下是获取相同数据的方法:
weight_cat值(这些是它唯一具有的不同值)。这些箱线图应显示身高随体重类别(weight_cat)的变化。因此,我有这样一个数据框:
print data.head(5)

        Height    Weight  weight_cat
Index
1      65.78331  112.9925           1
2      71.51521  136.4873           2
3      69.39874  153.0269           3
4      68.21660  142.3354           2
5      67.78781  144.2971           2
下面的代码最终占用了我所有的内存。我认为这不正常:
Seaborn.boxplot(x="Height", y="weight_cat", data=data)
这里有什么问题吗?这是手册的链接。数据框的形状为(25000, 4)。这是csv文件的链接。
以下是获取相同数据的方法:
data = pd.read_csv('weights_heights.csv', index_col='Index')
def weight_category(weight):
    newWeight = weight
    if newWeight < 120:
        return 1

    if newWeight >= 150:
        return 3

    else:
        return 2

data['weight_cat'] = data['Weight'].apply(weight_category)
boxplot。 - RocketqSeaborn.boxplot(x = data.Height, y = data.weight_cat)会导致相同的问题。我相信这不是问题的原因。 - Rocketq