Seaborn的箱线图似乎无法理解widths=参数。
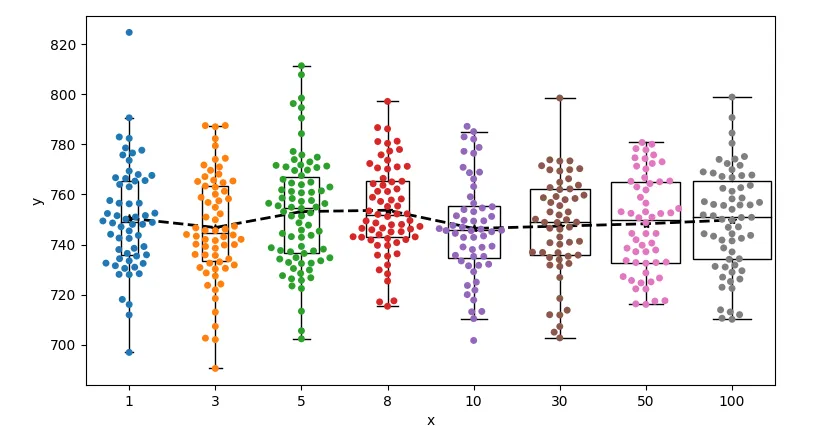
这里有一种使用matplotlib的boxplot每个x值创建一个箱线图的方法,该方法接受width=参数。下面的代码假设数据已经组织在panda的数据框中。
from matplotlib import pyplot as plt
import numpy as np
import pandas as pd
import seaborn as sns
df = pd.DataFrame({'x': np.random.choice([1, 3, 5, 8, 10, 30, 50, 100], 500),
'y': np.random.normal(750, 20, 500)})
xvals = np.unique(df.x)
positions = range(len(xvals))
plt.boxplot([df[df.x == xi].y for xi in xvals],
positions=positions, showfliers=False,
boxprops={'facecolor': 'none'}, medianprops={'color': 'black'}, patch_artist=True,
widths=[0.2, 0.3, 0.4, 0.5, 0.6, 0.7, 0.8, 0.9])
means = [np.mean(df[df.x == xi].y) for xi in xvals]
plt.plot(positions, means, '--k*', lw=2)
sns.swarmplot('x', 'y', data=df)
plt.show()
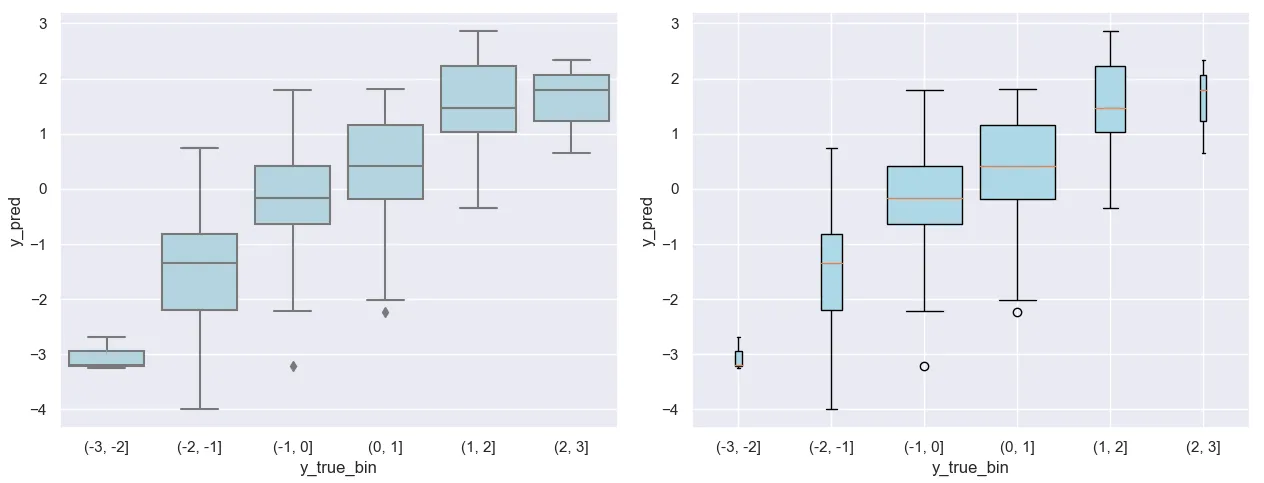
有一篇相关问题问如何根据群组大小设置框的宽度。可以将宽度计算为某个最大宽度乘以每个群组的大小与最大群组大小的比值。
from matplotlib import pyplot as plt
import numpy as np
import pandas as pd
import seaborn as sns

y_true = np.random.normal(size=100)
y_pred = y_true + np.random.normal(size=100)
df = pd.DataFrame({'y_true': y_true, 'y_pred': y_pred})
df['y_true_bin'] = pd.cut(df['y_true'], range(-3, 4))

sns.set()
fig, (ax1, ax2) = plt.subplots(ncols=2, figsize=(12, 5))
sns.boxplot(x='y_true_bin', y='y_pred', data=df, color='lightblue', ax=ax1)

bins, groups = zip(*df.groupby('y_true_bin')['y_pred'])
lengths = np.array([len(group) for group in groups])
max_width = 0.8
ax2.boxplot(groups, widths=max_width * lengths / lengths.max(),
            patch_artist=True, boxprops={'facecolor': 'lightblue'})
ax2.set_xticklabels(bins)
ax2.set_xlabel('y_true_bin')
ax2.set_ylabel('y_pred')
plt.tight_layout()
plt.show()
plt.xticks(positions, xvals)。也许您没有更改旧的plt.xticks(range(1, len(xvals)+1), xvals),因为那会使值发生偏移。均值需要使用与箱线图相同的positions进行绘制。 - JohanCwidths就不起作用了。 - buhtzwidths参数。如果您还想包括hue,那么如何支持色调躲避并仍然获得漂亮的图形,同时避免重叠的框和框之间太远的距离,这将变得更加不明显。 - JohanC