我想从数据框中绘制条形图和折线图。以下是代码,
library("ggplot2")

numb <- c(1,2,3,4,5,6,7,8,9)
mydist <- c(53.846154,15.384615,15.384615,7.692308,7.692308,0,0,0,0)
basedist <- c(30.103,17.609126,12.493874,9.691001,7.918125,6.694679,5.799195,5.115252,4.575749)
df <- data.frame(numb, mydist, basedist)

ggplot(data=df,aes(x=numb)) +
  geom_bar(stat="identity", aes(y=mydist), colour="green", fill="green") +
  geom_line(aes(y=basedist,group=1, colour="base distribution")) +
  geom_point(aes(y=basedist), colour="red") +
  ggtitle("My Chart") +
  labs(x="numb", y="percentage") +
  scale_x_discrete(limits=c("1","2","3","4","5","6","7","8","9")) +
  scale_y_continuous(breaks=seq(0,100,10)) +
  theme(axis.title.x = element_text(size=10, colour ="#666666")) +
  theme(axis.title.y = element_text(size=10, color="#666666")) +
  theme(plot.title = element_text(size=16, face="bold", hjust=0, color="#666666")) +
  theme(axis.text = element_text(size=12)) +
  theme(legend.title = element_text(colour="white", size = 16, face='bold'))
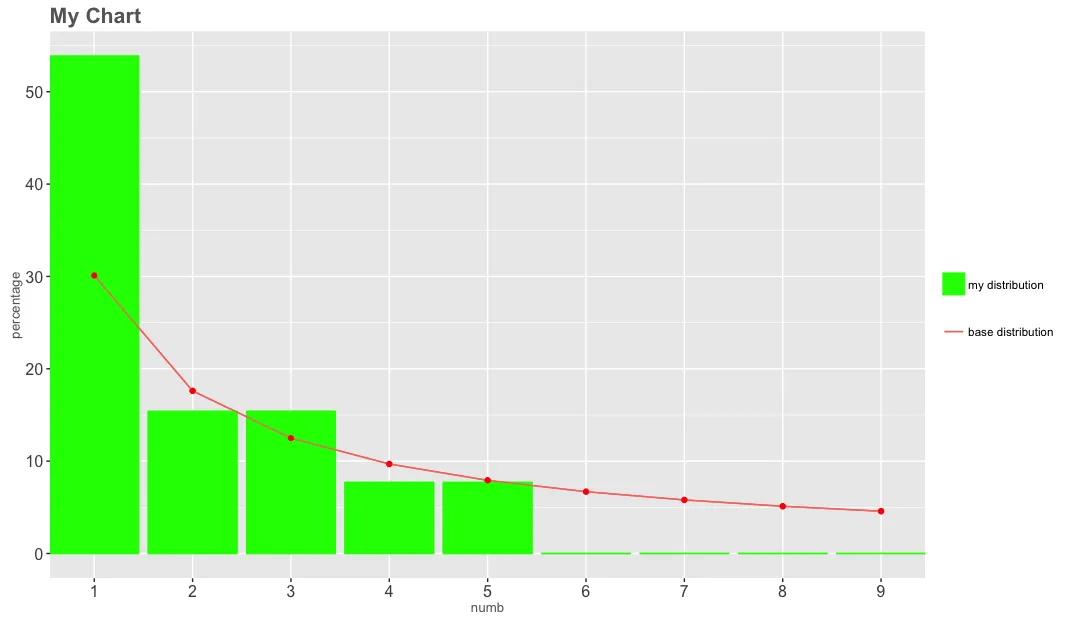
结果不是我想要的,因为条形图没有图例
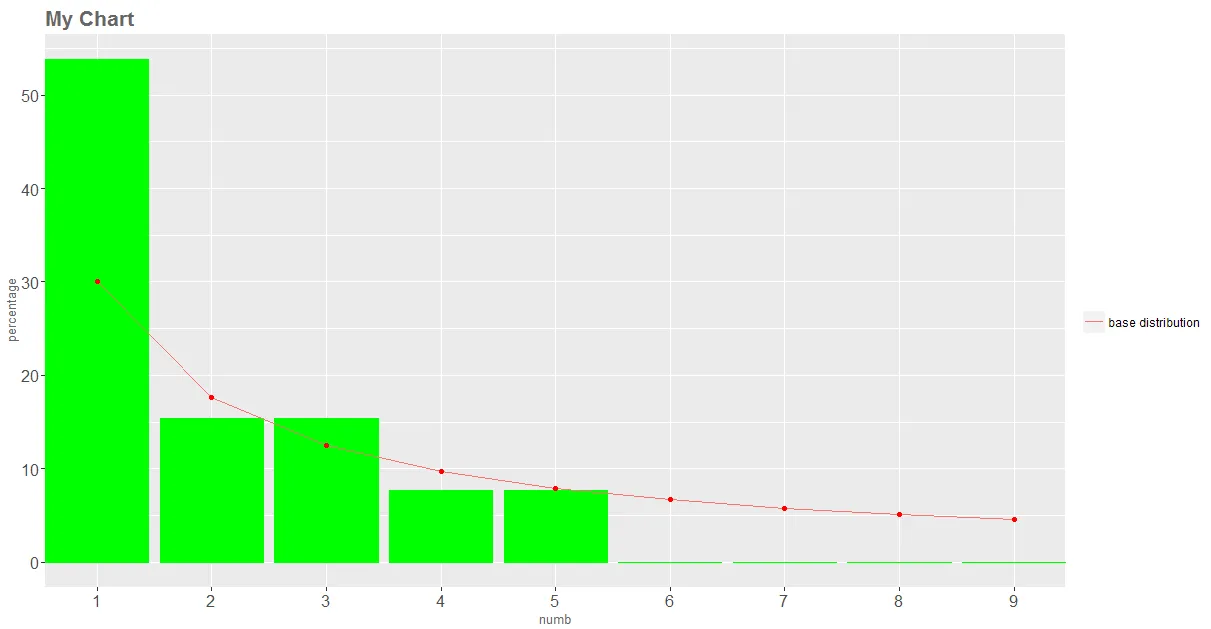
 我需要更改我的代码以获取所需的图表吗?
谢谢, Lobbie