ggplot2为多个stat_functions添加图例

13

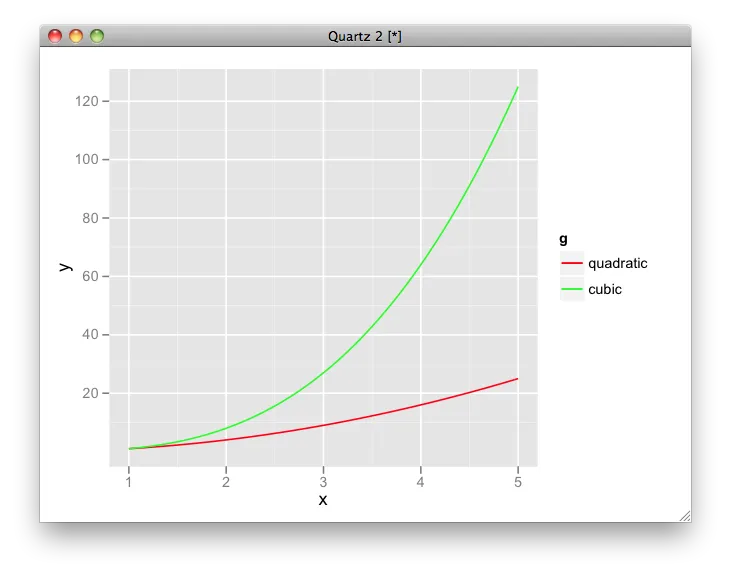
我看到很多关于如何自定义图例的问题,但是我连一个可以自定义的图例都没有。我想要一个图例,解释黑色线是二次函数,绿色线是三次函数。

library(ggplot2)

myfun1 <- function(x) x^2
myfun2 <- function(x) x^3

myplot <- ggplot(data = data.frame(x = 1:5, y= 1:5), aes(x=x, y=y)) +
    stat_function(fun = myfun1, color="green") +
    stat_function(fun = myfun2, color="black")
1个回答

18

尝试这个:

ggplot(NULL, aes(x=x, colour = g)) +
  stat_function(data = data.frame(x = 1:5, g = factor(1)), fun = myfun1) +
  stat_function(data = data.frame(x = 1:5, g = factor(2)), fun = myfun2) +
  scale_colour_manual(values = c("red", "green"), labels = c("quadratic", "cubic"))

在此输入图片描述


如何将连续的颜色比例尺添加到此处? - Aditya Sharma

网页内容由stack overflow 提供, 点击上面的
可以查看英文原文,
原文链接