ggplot2如何在堆叠条形图上添加标签

3
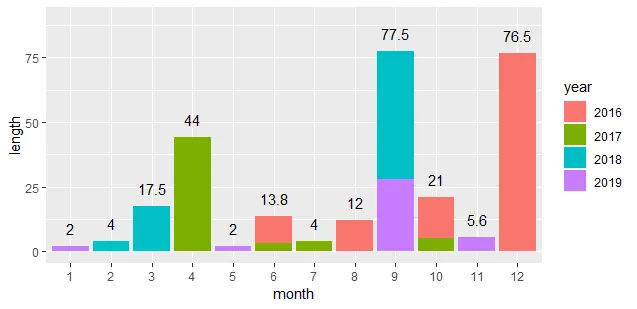
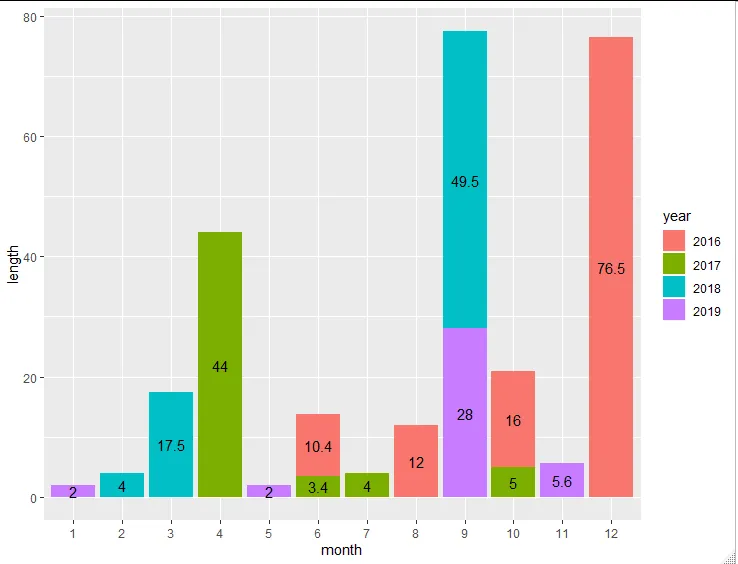
我想要在每个条形图的顶部标注我的函数调用输出(即每月长度的总和)。
我已经尝试将所需数字存储在向量中并将其用作标签,但这没有起作用。
以下是我的示例代码:
library(ggplot2)

month<-c(1,3,2,4,3,10,12,4,9,5,6,6,7,9,9,8,10,9,11,12,9)
length<-c(2,3.5,4,10,14,16,20,34,10.5,2,10.4,3.4,4,5,6,12,5,34,5.6,56.5,22)
year<-c(2019,2018,2018,2017,2018,2016,2016,2017,2018,2019,2016,2017,2017,2018,2019,2016,2017,2018,2019,2016,2019)

df<-data.frame(month,length,year)


ggplot(df) +
  geom_bar(aes(month, length, fill = as.factor(year)), 
           position = "stack", stat = "summary", fun.y = "sum")+
  scale_x_continuous(breaks = seq(1,12,by = 1))

有没有办法直接使用 fun.y="sum" 的输出作为 geom_text() 的标签呢?


到目前为止,我还没有弄清楚如何使用ggplot2派生的摘要统计信息来堆叠文本,但您可以关注此GitHub问题以查看事情是否会改变。 - aosmith
可能是在ggplot2中显示堆叠条形图上的数据值的重复问题。 - Mikko Marttila
2个回答

4

根据文档:

... 如果你想让条形图的高度表示数据中的值,请使用 geom_col()。...

因此,您可以使用更加简洁的代码重现您的结果(我还将明显的因素进行了转换)。

library(tidyverse)

month <- c(1,3,2,4,3,10,12,4,9,5,6,6,7,9,9,8,10,9,11,12,9)
length <- c(2,3.5,4,10,14,16,20,34,10.5,2,10.4,3.4,4,5,6,12,5,34,5.6,56.5,22)
year <- c(2019,2018,2018,2017,2018,2016,2016,2017,2018,2019,2016,2017,2017,2018,2019,2016,2017,2018,2019,2016,2019)

data.frame(month,length,year) %>% 
  mutate(
    month = as.factor(month),
    year = as.factor(year)) ->
  df

df %>% 
  ggplot() +
  geom_col(aes(month, length, fill = year))

在 ggplot 中使用 stat= 始终是一种烦恼,因此使用强大的 dplyr 动词预先计算统计量会更容易。

df %>% 
  group_by(month) %>% 
  mutate(monthly = sum(length)) %>% 
  ggplot() +
  geom_col(aes(month, length, fill = year)) +
  geom_text(aes(month, monthly, label = monthly),
            vjust = -1) +
  ylim(0, 90)

这种方法的缺陷是会重复打印一些标签,覆盖在彼此之上。您可以创建一个单独的数据集来解决这个问题。

df %>% 
  ggplot() +
  geom_col(aes(month, length, fill = year)) +
  geom_text(aes(month, monthly, label = monthly),
            vjust = -1,
            data = . %>% group_by(month) %>% summarise(monthly = sum(length))) +
  ylim(0, 90)

我在代码中使用了点号.代替数据框的引用,因此如果您想使用不同的数据集,则只需更改一个df实例即可。

enter image description here


3

如果摘要结果可以直接用于 geom_text,我不知道你的问题的答案。但是我提出了另一个解决方案:

library(ggplot2)
library(dplyr)

month<-c(1,3,2,4,3,10,12,4,9,5,6,6,7,9,9,8,10,9,11,12,9)
length<-c(2,3.5,4,10,14,16,20,34,10.5,2,10.4,3.4,4,5,6,12,5,34,5.6,56.5,22)
year<-c(2019,2018,2018,2017,2018,2016,2016,2017,2018,2019,2016,2017,2017,2018,2019,2016,2017,2018,2019,2016,2019)

df<-data.frame(
  year = as.factor(year),
  month = as.factor(month),
  length
)

df %>% 
  group_by(year, month) %>% 
  summarise(length = sum(length)) %>% 
  arrange(month, desc(year)) %>%
  plyr::ddply("month", transform, label_pos = cumsum(length) - .5 * length) %>% ## calculate label offset
  ggplot(aes(month, length)) +
  geom_bar(aes(fill = year), position = "stack", stat = "identity") +
  geom_text(aes(label = length, y = label_pos))

enter image description here


如果您想让每月的百分比总和达到100%,您可以使用 scales 包。
df %>% 
  group_by(year, month) %>% 
  summarise(length = sum(length)) %>% 
  group_by(month) %>% 
  mutate(perc = scales::percent(round(length / sum(length), 3))) %>% 
  arrange(month, desc(year)) %>%
  plyr::ddply("month", transform, label_pos = cumsum(length) - .5 * length) %>% ## calculate label offset
  ggplot(aes(month, length)) +
  geom_bar(aes(fill = year), position = "stack", stat = "identity") +
  geom_text(aes(label = perc, y = label_pos))

enter image description here


再次感谢您的帮助。是否还有一种方法可以将这些值转换为每月相加达到100%的百分比? - Lutz
1
我添加了一个示例,使用scales包来显示百分比。 - eastclintw00d

网页内容由stack overflow 提供, 点击上面的
可以查看英文原文,
原文链接