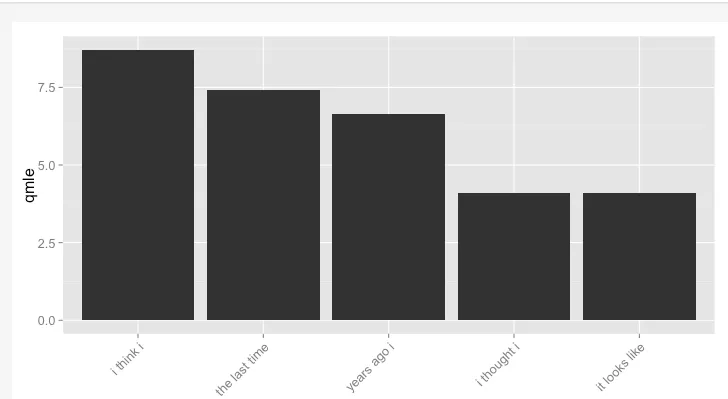
我正在一个shiny应用程序中使用ggplot2绘制条形图。
textOutput的输入。我尝试在闪亮的文档中找到例子,但那里大多是关于从指针位置返回x和y值的。有没有一个示例可以作为起点?我有同样的问题,并找到了这篇帖子。我意识到这个问题已经相当古老,但也许仍然有人对解决方案感兴趣。
挑战:
你面临的问题是ggplot将被呈现为图像: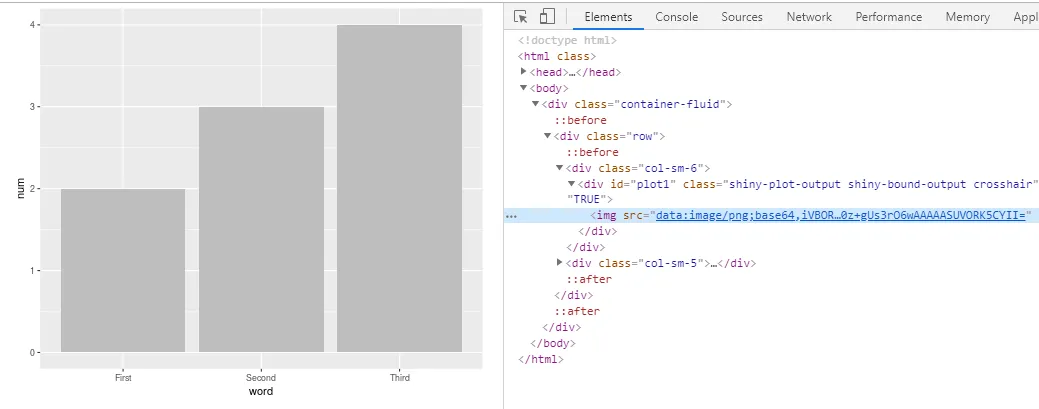
因此你没有单独的HTML元素可以监听。
解决方案:
但是,在shiny的ggplots中有一个有趣的功能。如果你向绘图添加一个点击监听器,则单击事件的$x变量将缩放到图片中的元素数量。因此,如果你添加了一个onlick监听器,则round($click$x)将等于被单击的元素。
在这里查看示例: https://shiny.rstudio.com/articles/plot-interaction-advanced.html
可重复的例子:
我使用文本框和高亮显示实现了一种解决方案,其中高亮显示部分来自Highlight a single "bar" in ggplot。
解决方案如下:
样本数据:
letters <- data.frame(
  word = c("First", "Second", "Third"),
  num = c(2, 3, 4),
  stringsAsFactors = FALSE
)
library(shiny)
library(ggplot2)

ui <- fluidPage(
  fluidRow(
    column(6,
           plotOutput("plot1", click = "plot1_click")
    ),
    column(5,
           uiOutput("text")
    )
  )
)

server <- function(input, output) {
  global <- reactiveValues(toHighlight = rep(FALSE, length(letters$word)),
    selectedBar = NULL)

  observeEvent(eventExpr = input$plot1_click, {
    global$selectedBar <- letters$word[round(input$plot1_click$x)]
    global$toHighlight <- letters$word %in% global$selectedBar
  })

  output$plot1 <- renderPlot({
    ggplot(data = letters, aes(x = word, y = num, fill = ifelse(global$toHighlight,
      yes = "yes", no = "no"))) +
      geom_bar(stat="identity") +
      scale_fill_manual(values = c("yes" = "blue", "no" = "grey" ), guide = FALSE )
  })

  output$text <- renderUI({
    req(global$selectedBar)
    textInput(inputId = "label", label = "selected text:", value = global$selectedBar)
  })
}
shinyApp(ui, server)
ggplot2的解决方案吗?如果不是,你也可以看看 rcharts。 - NicE