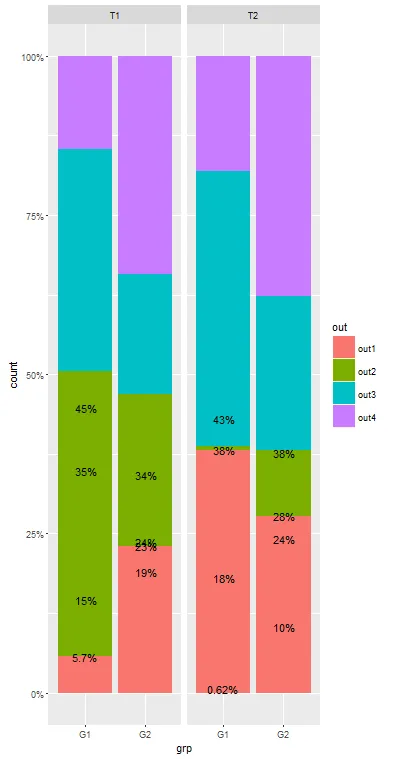
我希望在一张填充的条形图上添加百分比数字。这是错误放置标签的图表示例:
现在,我将组/处理内的总和添加到数据框中(使用 SQL,抱歉!):
x0 <- expand.grid(grp    = c("G1","G2")
                 , treat = c("T1","T2")
                 , out   = c("out1","out2","out3","out4")
)
set.seed(1234)
x0$n <- round(runif(16,0,1)*100,0)
head(x0)
  grp treat  out  n
1  G1    T1 out1 11
2  G2    T1 out1 62
3  G1    T2 out1 61
4  G2    T2 out1 62
5  G1    T1 out2 86
6  G2    T1 out2 64
现在,我将组/处理内的总和添加到数据框中(使用 SQL,抱歉!):
x0 <- sqldf(paste("SELECT a.*, (SELECT SUM(n)"
                  ,"            FROM x0 b"
                  ,"            WHERE a.grp = b.grp"
                  ,"                  AND a.treat = b.treat"
                  ,"           ) tot"
                  ," FROM x0 a"
                  ," ORDER BY a.grp,a.treat,a.out"
                  )
            )
x0$p <- with(x0, n/tot)
x0$p2 <- with(x0, paste(formatC(p*100, digits=2
              , format="fg"),"%",sep=""))
head(x0)
  grp treat  out  n tot          p    p2
1  G1    T1 out1 11 192 0.05729167  5.7%
2  G1    T1 out2 86 192 0.44791667   45%
3  G1    T1 out3 67 192 0.34895833   35%
4  G1    T1 out4 28 192 0.14583333   15%
5  G1    T2 out1 61 160 0.38125000   38%
6  G1    T2 out2  1 160 0.00625000 0.62%
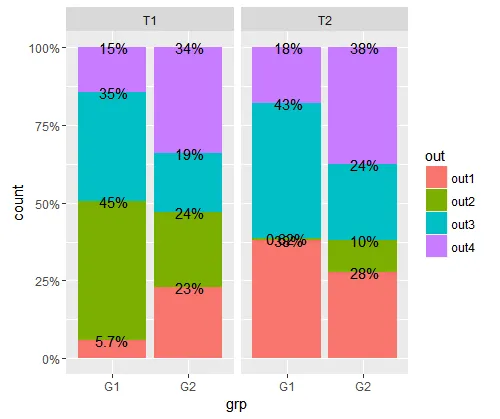
以下是我获取图表的方法:
ggplot(x0, aes(grp, weight=n)) +
         geom_bar(aes(fill = out), position = "fill") +
         facet_grid(.~treat) +
         scale_y_continuous(labels=percent) +
         geom_text(aes(label=p2, y=p))
我可以向数据框添加一个新变量,其中包括累积百分比,但我想知道是否有更简单的方法来添加标签。
geom_text中使用position = "stack"或者为 y 轴上的位置创建一个新变量来实现。 - aosmithposition = "stack"也是一样的。我看了其他关于这个问题的SO条目(例如你的链接)。主要区别在于我在geom_bar()中使用了选项position = "fill"。 - giordanogeom_text中添加了position = "stack"(而不是geom_bar)? 如果我将该选项添加到您的代码中,它可以正常工作。 你可能会发现你需要对非常小的百分比做一些处理。 像label = ifelse(p < .05, NA, p2)这样的东西可能就足够了。 - aosmithout升序排序时才会给出正确的解决方案。 - giordanoposition = "stack"取决于数据集的顺序(请参见这里)。 - aosmith