非常抱歉,如果这是一个重复的问题。但出于某种原因,以前给出的答案对我没有用。
我有以下数据框:
Country<-c("Chile", "Chile", "Finland","Finland")
Taxa<-c("Mammalia","Amphibia","Mammalia","Amphibia")
Loss<-c(0.15, 1, 0.2, 0.75)
df<-data.frame(Country, Taxa, Loss)
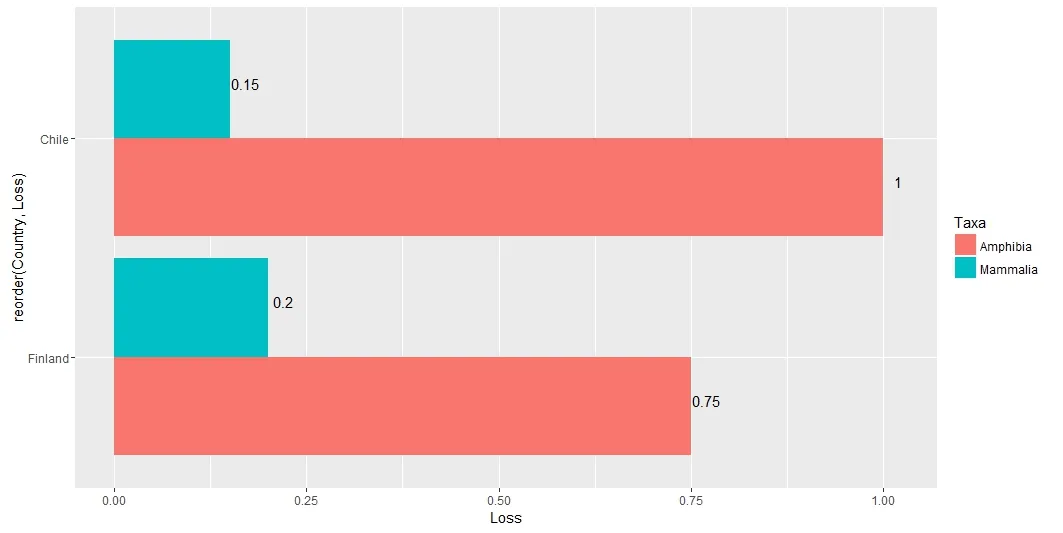
我希望将其显示为排名并添加标签。这是我得到的内容:
ggplot(df,aes(x=reorder(Country, Loss), y=Loss)) +
geom_bar(aes(fill = Taxa), position="dodge", stat="identity") +
labs(x = "", y = "")+
ylim(0,1)+
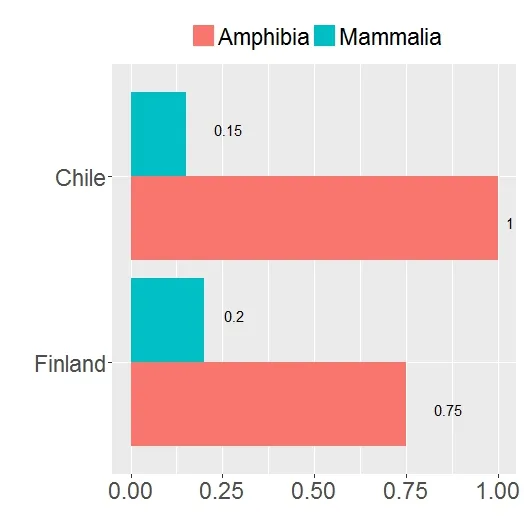
theme (legend.position="top", legend.title = element_blank(),legend.text = element_text(size = 17),
axis.text.x = element_text(size=17),
axis.text.y = element_text(size=17), axis.title.y=element_text(size=17))+
geom_text(aes(label = Loss), position=position_dodge(width=1))+
coord_flip()
一切正常!只是我无法按照自己的意愿定位标签。我希望标签在柱形图旁边。我尝试调整width,以及一些vjust和hjust,但位置从未改变...我做错了什么?
提前感谢!