我有一些需要放入堆叠条形图的数据,但是当我添加计数标签时,有些标签在类别上方,有些在类别下方。我尝试修改geom_text函数的位置参数,但无济于事。
以下是一个可重现的示例,显示“Under”类别座位的标签在该类别上方,“Over”类别座位的标签在条中内部。
以下是输出图表。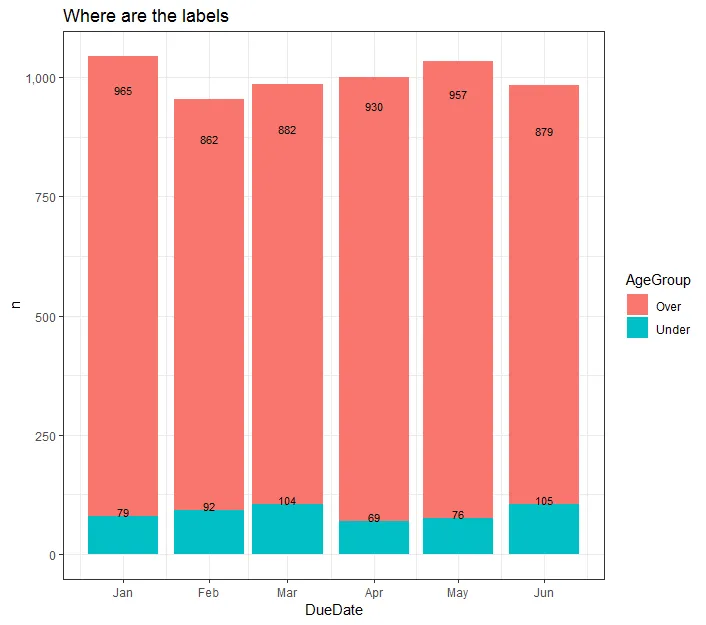
以下是一个可重现的示例,显示“Under”类别座位的标签在该类别上方,“Over”类别座位的标签在条中内部。
library(tidyverse)

data.frame(AgeGroup = sample(c(rep("Over",10),"Under"), 6000, replace = TRUE),
DueDate = sample(
         seq( as.Date("2015-01-01"),
              as.Date("2015-06-30"), by="1 month") ,
         6000,replace = TRUE),
             stringsAsFactors = TRUE) %>%
group_by(AgeGroup,DueDate) %>%
  tally() %>% ungroup %>%
  ggplot() +
  geom_bar(aes(x=DueDate, y=n, fill = AgeGroup),stat = "identity") +
  geom_text(aes(x=DueDate, y=n
            ,label = prettyNum(n,big.mark = ","))
        , vjust = 0,  size = 2) +
  scale_y_continuous(labels = scales::comma) +
  theme_bw() +
  labs(title="Where are the labels")
以下是输出图表。

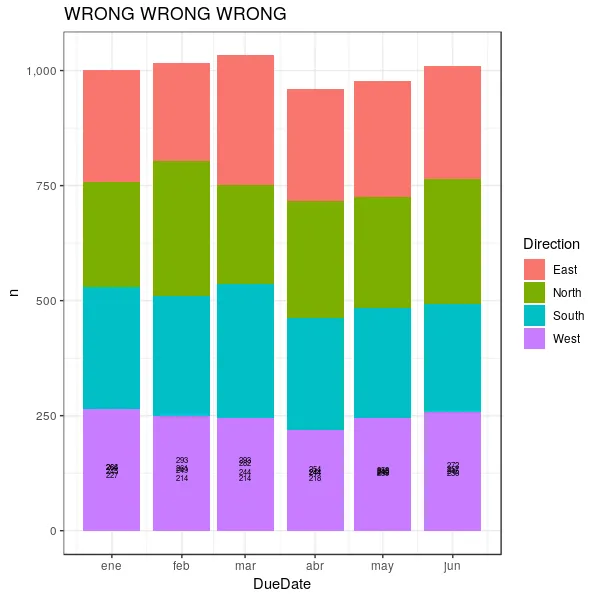
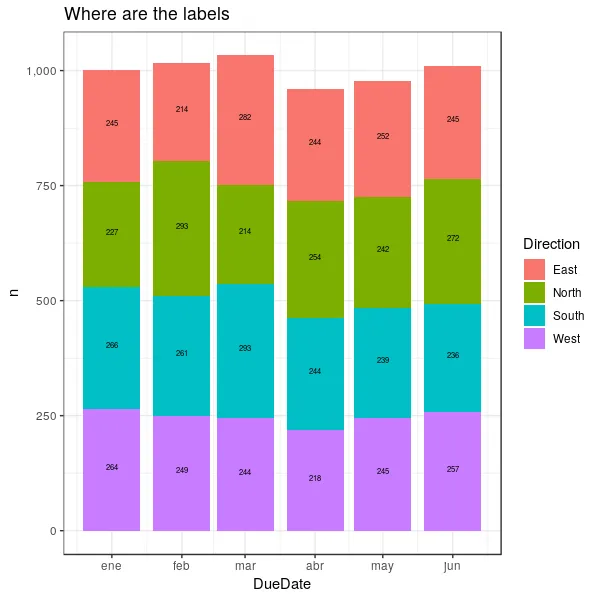
set.seed(),否则使用sample生成的数据并不是严格可再现的。 - neilfws