ggplot2:如何在分组条形图上添加线和p值?

5
我尝试通过阅读以下帖子的答案解决我的问题,但未成功: 使用R指示条形图中的统计显着差异如何绘制带有显著水平的箱线图?在ggplot条形图和箱线图上放置星号-以指示显著性水平(p值)
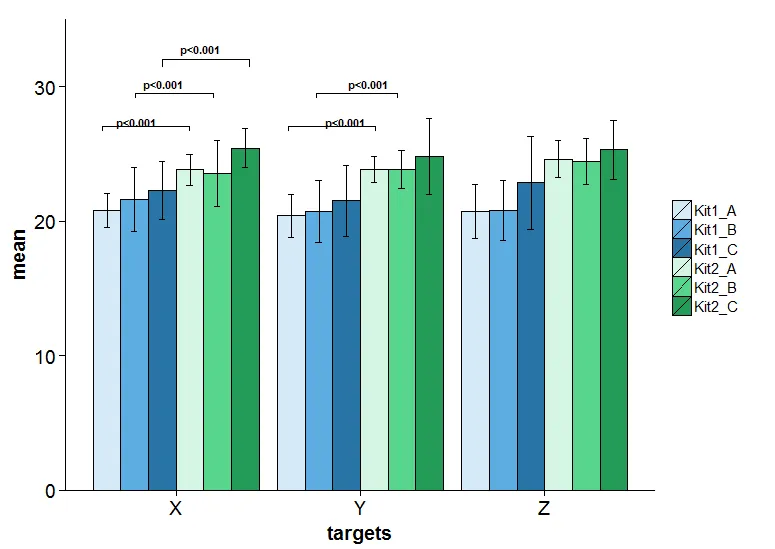
我想添加一些行和标签,以显示分组条形图中的显着性水平,就像红色矩形内部的那些一样。
这是我编写的简化代码版本:
#### DATA
g <- as.factor(c('Kit1_A', 'Kit2_A', 'Kit1_B', 'Kit2_B','Kit1_C', 'Kit2_C'))
groups  <- rep(g, 3)
targets <- c(rep('X', 6), rep('Y', 6), rep('Z', 6))
mean <- c(20.8, 23.8, 21.61667, 23.54583, 22.26250, 25.41250, 20.39583, 23.82917, 20.70000, 23.82917, 21.52083, 24.83333, 20.68750, 24.60000, 20.78750, 24.42083, 22.86667, 25.28750)
sd <- c(1.249251, 1.137451, 2.372480, 2.439704, 2.149715, 1.465997, 1.579936, 0.944777, 2.320555, 1.419932, 2.636766, 2.820217, 2.014647, 1.384187, 2.193378, 1.685869, 3.456228, 2.197052)
df  <-data.frame(groups, targets, mean, sd)

#### Barplot
library(ggplot2)
f <- ggplot(df, aes(x=targets, y=mean, fill=groups))
f <- f + geom_bar(position="dodge", stat="identity", colour='black')
f <- f + geom_errorbar(aes(ymin=mean-sd, ymax=mean+sd), width=.2,position=position_dodge(.9))
f <- f + theme(legend.title = element_blank())
f <- f + scale_fill_manual(values=c('#D6EAF8','#5DADE2','#2874A6','#D5F5E3','#58D68D','#239B56'))
f <- f + coord_cartesian(ylim = c(0, 35))

感谢您的任何帮助。
1个回答

8
也许这不是最好的答案,但你可以使用 annotate("rect")/annotate("segment")grid.text 或另一种选择是 annotation_custom(grob = linesGrob())
我使用了你的数据框和 annotate("rect") 以及 grid.text
更新后的代码如下:
# Add rectangles 
f + annotate("rect", xmin = 0.6, xmax = 1.07, ymin = 27, ymax =27, alpha=1,colour = "black")+
    annotate("rect", xmin = 0.6, xmax = 0.6, ymin = 26.7, ymax =27, alpha=1, colour = "black")+
    annotate("rect", xmin = 1.07, xmax = 1.07, ymin = 26.7, ymax =27, alpha=1, colour = "black")+
    annotate("rect", xmin = 0.778, xmax = 1.2, ymin = 29.5, ymax =29.5, alpha=1,colour = "black") +
    annotate("rect", xmin = 0.778, xmax = 0.778, ymin = 29.2, ymax =29.5, alpha=1,colour = "black") +
    annotate("rect", xmin = 1.2, xmax = 1.2, ymin = 29.2, ymax =29.5, alpha=1,colour = "black") +
    annotate("rect", xmin = 0.925, xmax = 1.4, ymin = 32, ymax =32, alpha=1,colour = "black") +
    annotate("rect", xmin = 0.925, xmax = 0.925, ymin = 31.5, ymax =32, alpha=1,colour = "black") +
    annotate("rect", xmin = 1.4, xmax = 1.4, ymin = 31.5, ymax =32, alpha=1,colour = "black") +

  # Second two lines
    annotate("rect", xmin = 1.61, xmax = 2.08, ymin = 27, ymax =27, alpha=1,colour = "black")+
    annotate("rect", xmin = 1.61, xmax = 1.61, ymin = 26.7, ymax =27, alpha=1, colour = "black")+
    annotate("rect", xmin = 2.08, xmax = 2.08, ymin = 26.7, ymax =27, alpha=1, colour = "black")+
    annotate("rect", xmin = 1.76, xmax = 2.2, ymin = 29.5, ymax =29.5, alpha=1,colour = "black") +
    annotate("rect", xmin = 1.76, xmax = 1.76, ymin = 29.2, ymax =29.5, alpha=1,colour = "black") +
    annotate("rect", xmin = 2.2, xmax = 2.2, ymin = 29.2, ymax =29.5, alpha=1,colour = "black")


# Add text   

  grid.text((paste("p<0.001")),
              x = unit(0.15, "npc"), y = unit(0.77, "npc"), just = c("left", "bottom"), 
              gp = gpar(fontface = "bold", fontsize = 8, col = "black"))

  grid.text((paste("p<0.001")),
              x = unit(0.185, "npc"), y = unit(0.839, "npc"), just = c("left", "bottom"), 
              gp = gpar(fontface = "bold", fontsize = 8, col = "black"))

  grid.text((paste("p<0.001")),
              x = unit(0.233, "npc"), y = unit(0.902, "npc"), just = c("left", "bottom"), 
              gp = gpar(fontface = "bold", fontsize = 8, col = "black"))
  # Second two lines
  grid.text((paste("p<0.001")),
              x = unit(0.42, "npc"), y = unit(0.77, "npc"), just = c("left", "bottom"), 
              gp = gpar(fontface = "bold", fontsize = 8, col = "black"))

  grid.text((paste("p<0.001")),
            x = unit(0.45, "npc"), y = unit(0.839, "npc"), just = c("left", "bottom"), 
            gp = gpar(fontface = "bold", fontsize = 8, col = "black"))

以下是输出内容: 在此输入图像描述


1
谢谢!使用注释“rect”是个好主意,也非常有效。然后,我使用了注释“text”来显示p值。 f + annotate("text", x = 1.15, y = 31.25, label = "p = 0.01686", size = 3.5) - gmbaranzoni
1
很高兴能够帮助。如果这个答案有所帮助,请随意接受答案。 - Miha

网页内容由stack overflow 提供, 点击上面的
可以查看英文原文,
原文链接