我需要在现有的图表中添加第二个y轴,以用于出版。我已经找到了一种方法如何做到这一点 (https://rpubs.com/kohske/dual_axis_in_ggplot2)。然而,我对所需的代码并不是很理解。我找不到让右侧y轴也显示出来的方法,并且只隐藏顶部边框。我的代码漏掉了什么?
下面是我的虚拟数据:
df1 <- structure(list(month = structure(1:12, .Label = c("Apr", "Aug",
"Dec", "Feb", "Jan", "Jul", "Jun", "Mar", "May", "Nov", "Oct",
"Sep"), class = "factor"), RI = c(0.52, 0.115, 0.636666666666667,
0.807, 0.66625, 0.34, 0.143333333333333, 0.58375, 0.173333333333333,
0.5, 0.13, 0), sd = c(0.327566787083184, 0.162634559672906, 0.299555225848813,
0.172887246493199, 0.293010848165827, 0.480832611206852, 0.222785397486759,
0.381610777775321, 0.219393102292058, 0.3, 0.183847763108502,
0)), .Names = c("month", "RI", "sd"), class = "data.frame", row.names = c(NA,
-12L))
df2<-structure(list(month = structure(c(5L, 4L, 8L, 1L, 9L, 7L, 6L,
2L, 12L, 11L, 10L, 3L), .Label = c("Apr", "Aug", "Dec", "Feb",
"Jan", "Jul", "Jun", "Mar", "May", "Nov", "Oct", "Sep"), class = "factor"),
temp = c(25, 25, 25, 25, 25, 25, 25, 25, 25, 25, 25, 25)), .Names = c("month",
"temp"), row.names = c(NA, -12L), class = "data.frame")
library(ggplot2)
library(gtable)
library(grid)
p1 <-
ggplot(data = df1, aes(x=month,y=RI)) +
geom_errorbar(aes(ymin=0,ymax=RI+sd),width=0.2,color="grey") +
geom_bar(width=0.5,stat="identity",position=position_dodge()) +
scale_y_continuous(limits=c(0,1),expand = c(0,0)) + scale_x_discrete(limits=c("Jan","Feb","Mar","Apr","May","Jun","Jul","Aug","Sep","Oct","Nov","Dec")) +
theme_bw(base_size = 12, base_family = "Helvetica") +
theme(panel.grid = element_blank()) +
theme( # Increase size of axis lines
axis.line.x = element_line(size = .7, color = "black"),
axis.line.y = element_line(size = .7, color = "black"),
panel.border = element_blank())
p2 <-
ggplot(data=df2) +
geom_line(linetype="dashed",size=0.5,aes(x=month,y=temp,fullrange=T,group=1)) +
scale_y_continuous(name = "Water temperature (°C)", limits = c(20,32)) +
scale_x_discrete(limits=c("Jan","Feb","Mar","Apr","May","Jun","Jul","Aug","Sep","Oct","Nov","Dec")) +
theme_bw(base_size = 12, base_family = "Helvetica") +
theme(panel.grid = element_blank()) +
theme( # Increase size of axis lines
axis.line.x = element_line(size = .7, color = "black"),
axis.line.y = element_line(size = .7, color = "black"),
panel.border = element_blank())
# Get the ggplot grobs
g1 <- ggplotGrob(p1)
g2 <- ggplotGrob(p2)
# Get the location of the plot panel in g1.
# These are used later when transformed elements of g2 are put back into g1
pp <- c(subset(g1$layout, name == "panel", se = t:r))
# ggplot contains many labels that are themselves complex grob;
# usually a text grob surrounded by margins.
# When moving the grobs from, say, the left to the right of a plot,
# make sure the margins and the justifications are swapped around.
# The function below does the swapping.
# Taken from the cowplot package:
# https://github.com/wilkelab/cowplot/blob/master/R/switch_axis.R
hinvert_title_grob <- function(grob){
# Swap the widths
widths <- grob$widths
grob$widths[1] <- widths[3]
grob$widths[3] <- widths[1]
grob$vp[[1]]$layout$widths[1] <- widths[3]
grob$vp[[1]]$layout$widths[3] <- widths[1]
# Fix the justification
grob$children[[1]]$hjust <- 1 - grob$children[[1]]$hjust
grob$children[[1]]$vjust <- 1 - grob$children[[1]]$vjust
grob$children[[1]]$x <- unit(1, "npc") - grob$children[[1]]$x
grob
}
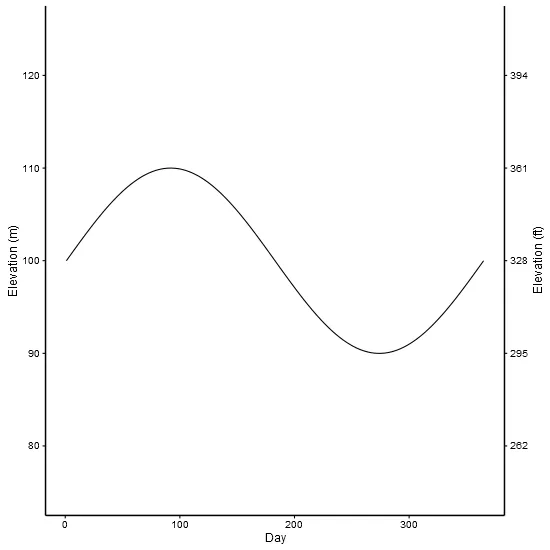
# Get the y axis title from g2 - "Elevation (ft)"
index <- which(g2$layout$name == "ylab") # Which grob contains the y axis title?
ylab <- g2$grobs[[index]] # Extract that grob
ylab <- hinvert_title_grob(ylab) # Swap margins and fix justifications
# Put the transformed label on the right side of g1
g1 <- gtable_add_cols(g1, g2$widths[g2$layout[index, ]$l], pp$r)
g1 <- gtable_add_grob(g1, ylab, pp$t, pp$r + 1, pp$b, pp$r + 1, clip = "off", name = "ylab-r")
# Get the y axis from g2 (axis line, tick marks, and tick mark labels)
index <- which(g2$layout$name == "axis-l") # Which grob
yaxis <- g2$grobs[[index]] # Extract the grob
# yaxis is a complex of grobs containing the axis line, the tick marks, and the tick mark labels.
# The relevant grobs are contained in axis$children:
# axis$children[[1]] contains the axis line;
# axis$children[[2]] contains the tick marks and tick mark labels.
# First, move the axis line to the left
yaxis$children[[1]]$x <- unit.c(unit(0, "npc"), unit(0, "npc"))
# Second, swap tick marks and tick mark labels
ticks <- yaxis$children[[2]]
ticks$widths <- rev(ticks$widths)
ticks$grobs <- rev(ticks$grobs)
# Third, move the tick marks
ticks$grobs[[1]]$x <- ticks$grobs[[1]]$x - unit(1, "npc") + unit(3, "pt")
# Fourth, swap margins and fix justifications for the tick mark labels
ticks$grobs[[2]] <- hinvert_title_grob(ticks$grobs[[2]])
# Fifth, put ticks back into yaxis
yaxis$children[[2]] <- ticks
# Put the transformed yaxis on the right side of g1
g1 <- gtable_add_cols(g1, g2$widths[g2$layout[index, ]$l], pp$r)
g1 <- gtable_add_grob(g1, yaxis, pp$t, pp$r + 1, pp$b, pp$r + 1, clip = "off", name = "axis-r")
# Draw it
grid.newpage()
grid.draw(g1)
axis.line对我来说被忽略了。而且?theme的例子也不起作用。在作者决定修复它之前,请尝试使用axis.line.x/axis.line.y。请附上您正在使用的工作示例和版本。 - rawrx=Inf处添加一个annotate("vline")。 - baptiste