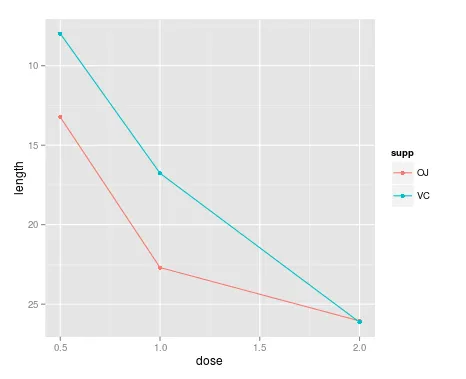
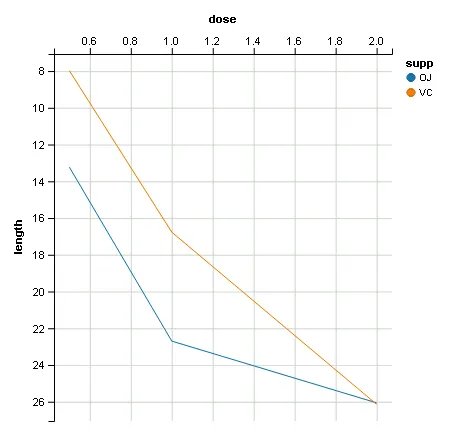
我正在尝试使用ggplot2绘制图表,要求y轴反向并且x轴在顶部。我使用了scale_y_reverse()来反转y轴,但是无法弄清如何将x轴放在顶部而不是底部。
dfn <- read.table(header=T, text='
supp dose length
  OJ  0.5  13.23
  OJ  1.0  22.70
  OJ  2.0  26.06
  VC  0.5   7.98
  VC  1.0  16.77
  VC  2.0  26.14
')

library(ggplot2)
p1 <- ggplot(data=dfn, aes(x=dose, y=length, group=supp, colour=supp)) + geom_line() + geom_point()
p1 <- p1 + scale_y_reverse()
print(p1)