是否可以使用ggplot2包中的geom_ribbon函数,并将范围水平而不是垂直绘制?如果“geom_ribbon”提供了xmin / xmax选项,那么这将是微不足道的,但情况并非如此。
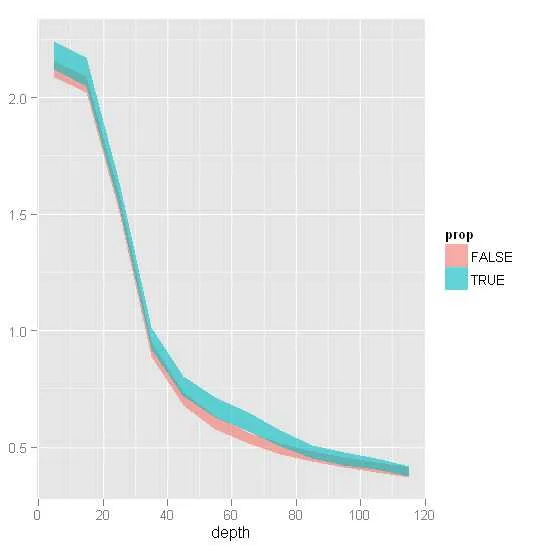
下面是我的数据,用于测试的简化绘图函数以及我得到的图形。因此,在这个例子中,我希望“深度”轴垂直显示。
prof <- read.table(text = " depth prop mean error
1 5 FALSE 2.12 0.035
2 15 FALSE 2.06 0.035
3 25 FALSE 1.54 0.035
4 35 FALSE 0.92 0.033
5 45 FALSE 0.71 0.028
6 55 FALSE 0.60 0.026
7 65 FALSE 0.54 0.024
8 75 FALSE 0.49 0.023
9 85 FALSE 0.46 0.022
10 95 FALSE 0.43 0.022
11 105 FALSE 0.41 0.022
12 115 FALSE 0.39 0.021
13 5 TRUE 2.18 0.061
14 15 TRUE 2.11 0.061
15 25 TRUE 1.58 0.054
16 35 TRUE 0.97 0.047
17 45 TRUE 0.76 0.042
18 55 TRUE 0.67 0.043
19 65 TRUE 0.61 0.040
20 75 TRUE 0.54 0.033
21 85 TRUE 0.48 0.028
22 95 TRUE 0.45 0.027
23 105 TRUE 0.43 0.025
24 115 TRUE 0.40 0.022", header=TRUE)

ggplot(prof, aes(colour = prop, fill = prop)) +
  geom_ribbon(aes(x = depth, ymin = mean-error, ymax = mean+error),
  alpha = 0.6, colour = NA)