在 ggplot2 中反转离散 y 轴的顺序

106

情况和数据

我有一个数据框 df,记录了运动员在一场比赛中的位置:

df <- structure(list(athlete = c("A", "B", "C", "D", "E", "F", "G",
"H", "I", "J", "A", "B", "C", "D", "E", "F", "G", "H", "I", "J", 
"A", "B", "C", "D", "E", "F", "G", "H", "I", "J", "A", "B", "C", 
"D", "E", "F", "G", "H", "I", "J", "A", "B", "C", "D", "E", "F", 
"G", "H", "I", "J", "A", "B", "C", "D", "E", "F", "G", "H", "I", 
"J"), distanceRemaining = structure(c(1L, 1L, 1L, 1L, 1L, 1L, 
1L, 1L, 1L, 1L, 2L, 2L, 2L, 2L, 2L, 2L, 2L, 2L, 2L, 2L, 3L, 3L, 
3L, 3L, 3L, 3L, 3L, 3L, 3L, 3L, 4L, 4L, 4L, 4L, 4L, 4L, 4L, 4L, 
4L, 4L, 5L, 5L, 5L, 5L, 5L, 5L, 5L, 5L, 5L, 5L, 6L, 6L, 6L, 6L, 
6L, 6L, 6L, 6L, 6L, 6L), .Label = c("1400m", "1200m", "600m", 
"400m", "200m", "FINISH"), class = "factor"), position = c(10, 
6, 7, 8, 2, 1, 3, 5, 9, 4, 9, 8, 7, 6, 4, 3, 1, 5, 10, 2, 8, 
7, 9, 5, 6, 2, 3, 1, 10, 4, 9, 8, 6, 5, 7, 3, 2, 4, 10, 1, 4, 
5, 1, 6, 8, 3, 2, 7, 10, 9, 1, 2, 3, 4, 5, 6, 7, 8, 9, 10)), row.names = c(NA, 
-60L), .Names = c("athlete", "distanceRemaining", "position"), class = "data.frame")
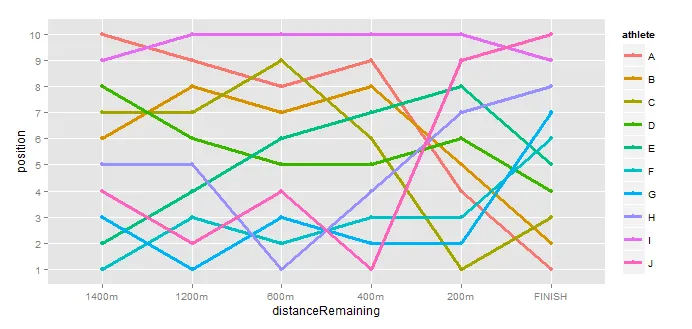
我正在使用绘图工具绘制数据

library(ggplot2)
g <- ggplot(df, aes(x=distanceRemaining, y =position, colour=athlete, group = athlete))
g <- g + geom_point()
g <- g + geom_line(size=1.15)
g <- g + scale_y_discrete()
g

提供

athletePositions

问题

如何反转y轴的顺序,使得底部为10,顶部为1?
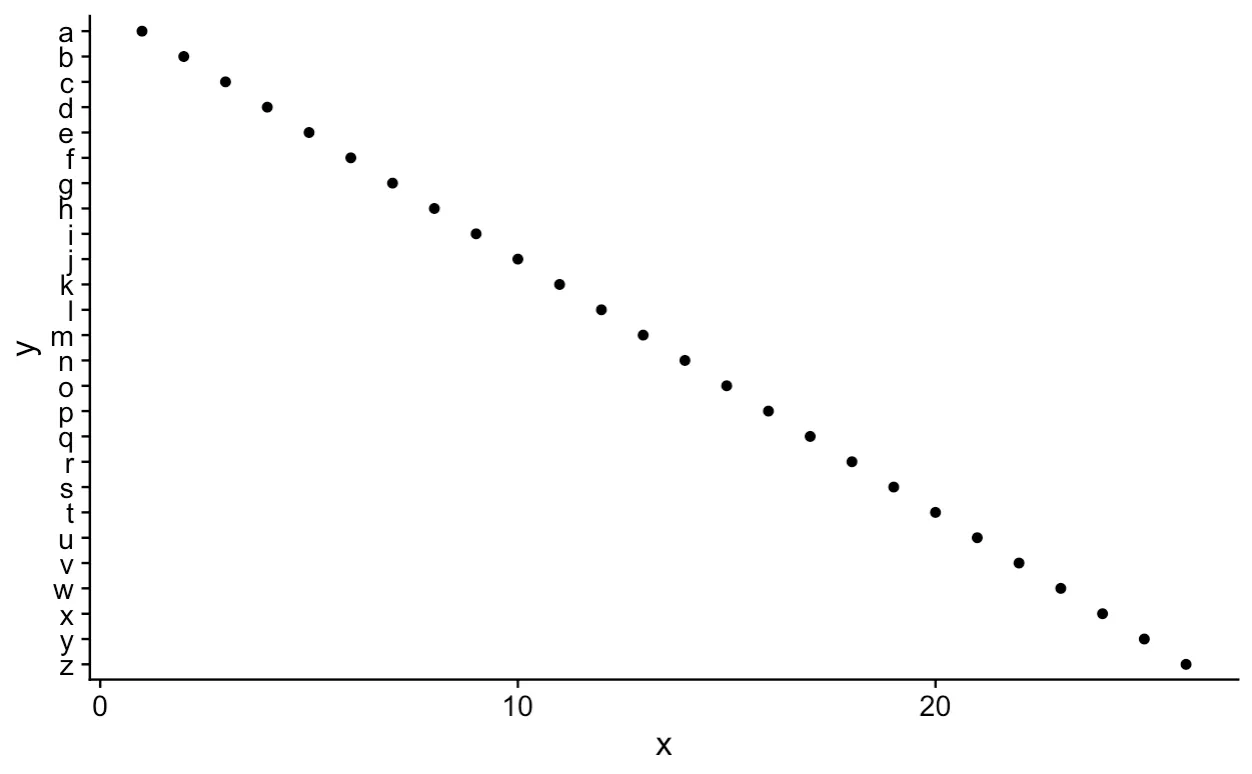
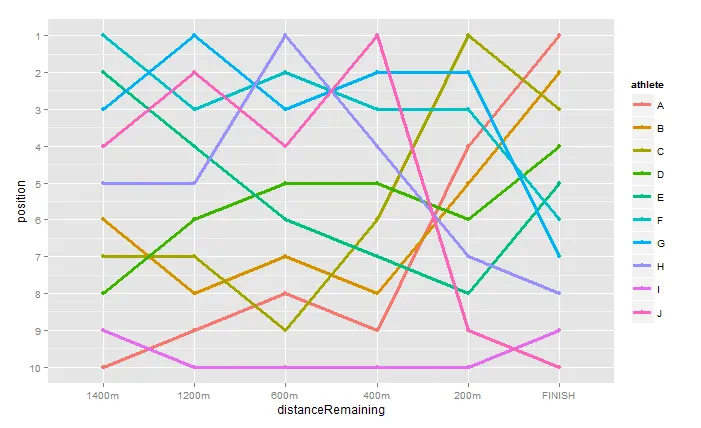
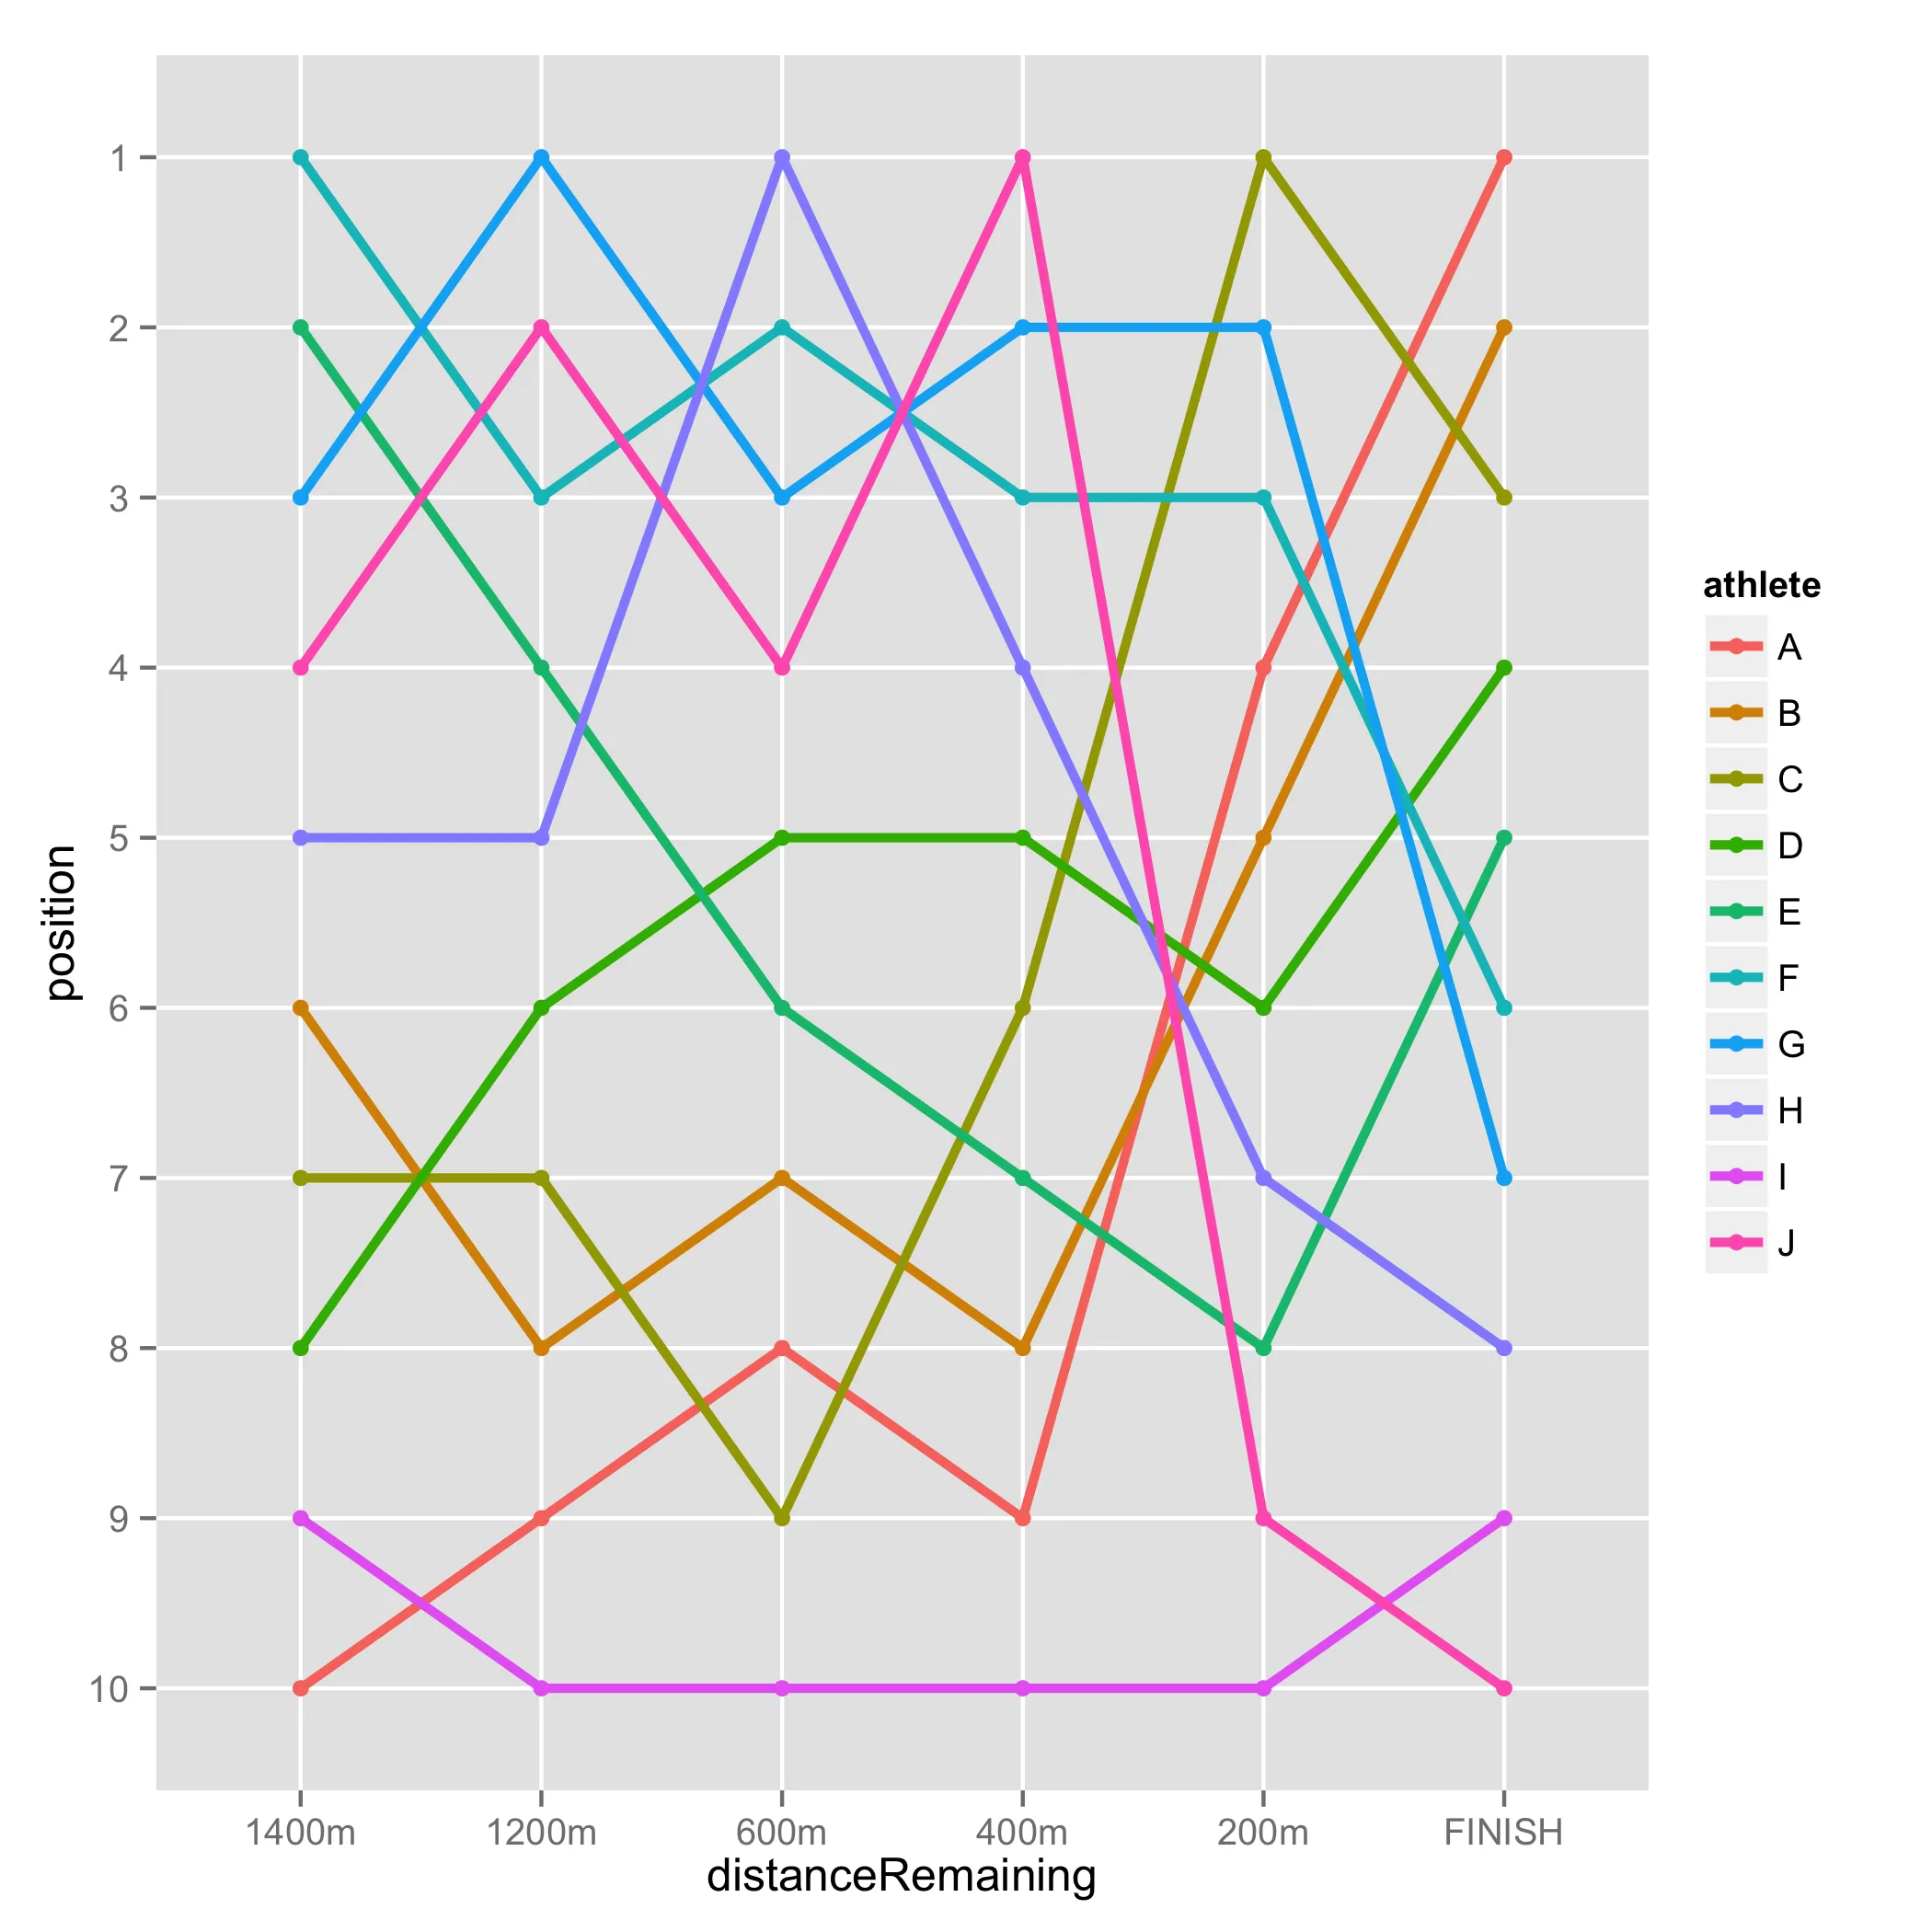
6个回答

155

有一个新的解决方案,scale_*_discrete(limits=rev),例如:

tibble(x=1:26,y=letters) %>% 
  ggplot(aes(x,y)) +
    geom_point() +
    scale_y_discrete(limits=rev)

在这里输入图片描述


另一种表示法可以是 scale_y_discrete(limits = \(x) rev(x)) - undefined

54

我真的很喜欢这个解决方案。它不会改变或重新调整因子本身(甚至是暂时的)。只是直接设置绘图的刻度/标签顺序。 - bdemarest
这仅适用于您拥有因子的情况。否则,我使用了@David Bloom的“重新排序”解决方案。 - dfrankow
ggplot已经推出了一种更优雅的解决方案,详见Frederik Ziebell的回答 - divibisan
这对我不起作用。 - Andrew McCartney

41

请尝试以下方法:

g <- ggplot(df, aes(x=distanceRemaining, y =position, colour=athlete, group = athlete))
g <- g + geom_point()
g <- g + geom_line(size=1.15)
g <- g +  scale_y_continuous(trans = "reverse", breaks = unique(df$position))
g

在此输入图像描述


3
你能否使用scale_y_reverse()scale_y_discrete()来保留y轴上的整数,或者使用其他方法? - tospig
22
在至少 ggplot2 版本 2.1 中,这对我不起作用。如果你给 scale_y_continuous 传递一个因子,它会报错。应该使用以下版本来处理因子:scale_y_discrete(limits = rev(levels(df$distanceRemaining))) - Curt F.
4
对于未来有困难的人,如果你曾经使用dplyr创建了一个group_df,你可能需要先取消对tibble的分组,以便按正确顺序获取因子。 - Jordan
1
可能最有用的答案来自@Frederik Ziebell。 - fc9.30
对于有大量条件的较大代码库,你不必通过在一个场景中使用scale_y_discrete(),在另一个场景中使用scale_y_reverse()来重复代码。只需使用可以通过“reverse”和“identity”打开和关闭的参数即可极其有用。对我来说,这是最好的答案。 - Matt

40

对于离散轴,我使用了 reorder()。在上述问题的背景下,它看起来会像这样:

ggplot(df, aes(x = distanceRemaining, y = reorder(position, desc(position))))

希望这可以帮到你。


我认为这是最好的解决方案,因为它不需要指向除已传递给ggplot的内容以外的任何东西。谢谢! - Stefano
如果不想使用 dplyr,可以使用 reorder(position, -position) - Sweepy Dodo

26

你只需要将位置变量转换为因子(factor),然后反转它的水平(levels):

require(dplyr)
df <- df %>% mutate(position = factor(position), 
                    position = factor(position, levels = rev(levels(position)))

然后使用您的代码,您将获得: 在此输入图像描述


谢谢,但我会选择保持在ggplot2调用内的答案。 - tospig
5
“trans = 'reverse'”方法不适用于真正离散的(例如字符)刻度。‘scale_y_reverse()’也可以使用,因为你的y轴可以被强制转换为连续刻度... - Paul 'Joey' McMurdie
你可以通过以下 ggplot2 调用来保留它:ggplot(df, aes(x=distanceRemaining, y=factor(position, levels=c(1:10)), colour=athlete, group = athlete)) - Brian D
谢谢,这解决了使用coord_flip()时的一个烦人问题。 - userABC123

10

使用forcats包的另一种选择。

ggplot(df, aes(x = distanceRemaining, y = forcats::fct_rev(factor(position))))

使用这种方法的好处是将所有内容都保留在ggplot调用中,并与其他选项(如coord_flipfacets_wrap(..., scales = "free"))完美结合。


网页内容由stack overflow 提供, 点击上面的
可以查看英文原文,
原文链接