这就像是我两年前发布的一个类似问题。我有以下数据集。
dat <- read.table(header=TRUE, text="
Age ColA    ColB    ColC    ColD    ColE    ColF    ColG
15-19   0.02307186  1.222808596 8.029007382 2.37640161  2.999341838 7.221492272 1.015161853
                  20-24 0   0.887751986 4.688258856 1.195273916 1.618841858 3.864332176 0.591834658
                  25-29 0.009286236 0.515386108 3.459122975 0.807902547 1.095775869 2.88801945  0.394665037
                  30-34 0.004488001 0.529584108 2.948616603 0.888624182 0.825792169 2.517768515 0.296208061
                  35-39 0.004255158 0.421260643 2.416929748 0.642528859 0.710611387 2.119068688 0.174461478
                  40-44 0.004353884 0.457157796 2.41205161  0.579066542 0.696621404 1.893939441 0.248171375
                  45-49 0.012267313 0.335306565 2.224472823 0.470247012 0.59700925  1.668354617 0.208544327
                  50-54 0   0.340838272 2.079544901 0.388296766 0.526357838 1.643789641 0.211406017
                  55-59 0.005389454 0.361093396 1.972540042 0.506608645 0.58745045  1.756961895 0.167073064
                  60-64 0   0.294592558 1.882518295 0.459851797 0.747259171 1.681333134 0.237111083
                  65-69 0.012027822 0.324751187 1.912423656 0.529224156 0.601391087 1.780117617 0.2766399
                  70-74 0   0.308161886 2.074956702 0.53414727  0.657412024 1.74625069  0.369794264
                  75-79 0   0.622740845 2.075802818 0.311370423 0.795724414 2.041206104 0.38056385
                  80-85 0   0.585088322 2.860431796 0.715107949 0.715107949 3.640549559 0.520078508
                  85-above  0   0.124500238 1.369502615 0.373500713 0.871501664 1.120502139 0.124500238
                  ")

dat

head(dat)
    Age        ColA      ColB     ColC      ColD      ColE     ColF      ColG
1 15-19 0.023071860 1.2228086 8.029007 2.3764016 2.9993418 7.221492 1.0151619
2 20-24 0.000000000 0.8877520 4.688259 1.1952739 1.6188419 3.864332 0.5918347
3 25-29 0.009286236 0.5153861 3.459123 0.8079025 1.0957759 2.888019 0.3946650
4 30-34 0.004488001 0.5295841 2.948617 0.8886242 0.8257922 2.517769 0.2962081
5 35-39 0.004255158 0.4212606 2.416930 0.6425289 0.7106114 2.119069 0.1744615
6 40-44 0.004353884 0.4571578 2.412052 0.5790665 0.6966214 1.893939 0.2481714
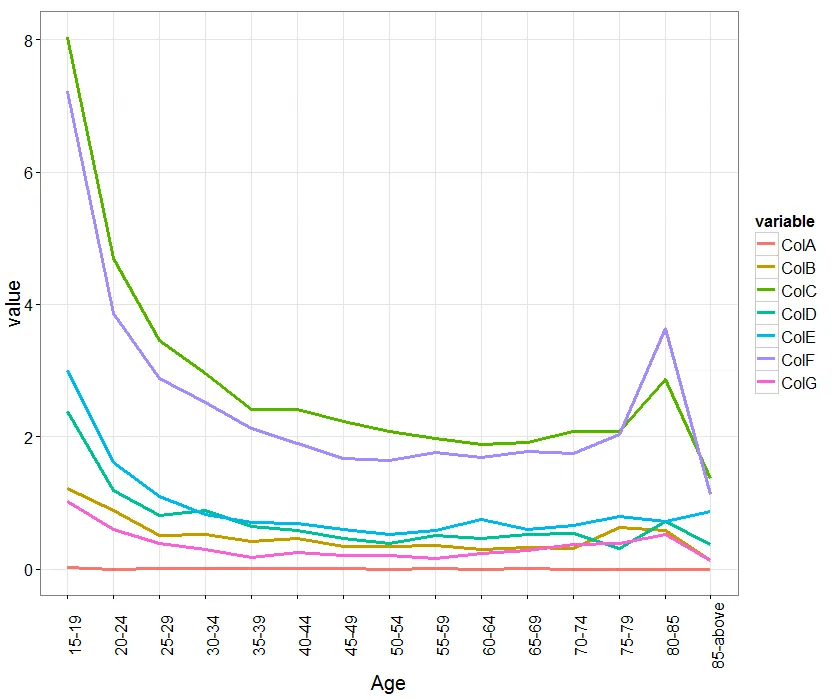
我使用了以下代码生成图表。
library(reshape2)
library(ggplot2)

dat1 <- melt(dat)
head(dat1)
p = ggplot(dat1, aes(x=Age, y=value, group=variable))
p + geom_line(aes(colour = variable), size=1.2)+theme_bw()+
  theme(text = element_text(size=20),
        axis.text.x = element_text(angle=90, vjust=1))
这是输出结果。
geom_line-那就没关系)。y轴将会是这样的:0-3,打破,7-8。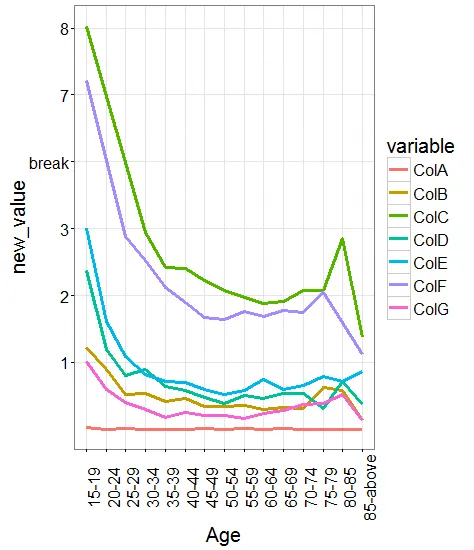
ggplot2中这样做。Hadley曾经谈到过他的编辑决定,尽可能地阻止人们干扰y轴(特别是破碎和双重)。 - alistaire