在R中如何打破X轴

18

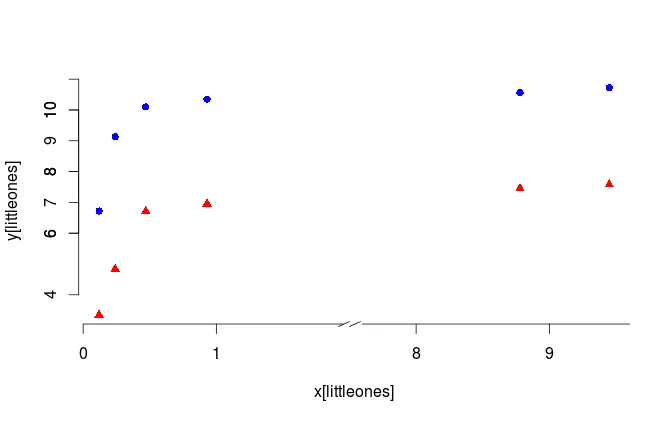
我想在我的图表中使用一个断裂的X轴。在X轴上,我想插入一个断裂轴符号< // > [从2开始并在结束于8,这意味着2-8将在< // >符号中隐藏]以便其他值可以突出显示。在Matlab中,可以使用BreakXAxis来完成此任务。在R中,plotrix库仅帮助插入断裂轴符号,就这些。

x <- c(9.45, 8.78, 0.93, 0.47, 0.24, 0.12)
y <- c(10.72, 10.56, 10.35, 10.10, 9.13, 6.72)
z <- c(7.578, 7.456, 6.956, 6.712, 4.832, 3.345)
plot(x, y, col='blue', pch=16, xlab= 'x', ylab='y, z')
points(x, z, col='red', pch=17)
library(plotrix)
axis.break(1,2,style="slash") 
2个回答

20

听起来你需要 gap.plot

library(plotrix)
par(bty="n") # deleting the box
gap.plot(x,y, gap=c(2,7.5), gap.axis="x", pch=16,
         col="blue", ylim=range(c(y,z)),
         xtics=c(0:3,8:10), xticlab=c(0:3,8:10))

gap.plot(x,z, gap=c(2,7.5), gap.axis="x", pch=17,
         col="red", ylim=range(c(y,z)), add=TRUE); axis(2)

abline(v=seq(1.99,2.09,.001), col="white")  # hiding vertical lines
axis.break(1,2,style="slash")               # plotting slashes for breakpoints

这里输入图片描述


17
xgap <- ifelse(x > 8, x-6, x)
#Possibly you'd want to check if there are values between 2 and 8.
plot(xgap, y, col='blue', pch=16, xlab= 'x', ylab='y, z', xaxt="n")
points(xgap, z, col='red', pch=17)
xat <- pretty(xgap)
xat <- xat[xat!=2]
xlab <- ifelse(xat>2, xat+6, xat)
axis(1,at=xat, labels=xlab)
library(plotrix)
axis.break(1,2,style="slash") 

在这里输入图片描述

不要这样做。 gap.plot 提供了一个稍微更好的替代方案,但我可能会使用 facets,例如 ggplot2。


网页内容由stack overflow 提供, 点击上面的
可以查看英文原文,
原文链接