我有一个数据库,想要使用stat_smooth显示一个图形。
我可以展示avg_time与Scored_Probabilities之间的图形,看起来像这样:
但是当将“平均时间”更改为“时间”或“年龄”时,会出现错误:
如何解决这个问题?
我可以展示avg_time与Scored_Probabilities之间的图形,看起来像这样:
c <- ggplot(dataset1, aes(x=Avg.time, y=Scored.Probabilities))
c + stat_smooth()
但是当将“平均时间”更改为“时间”或“年龄”时,会出现错误:
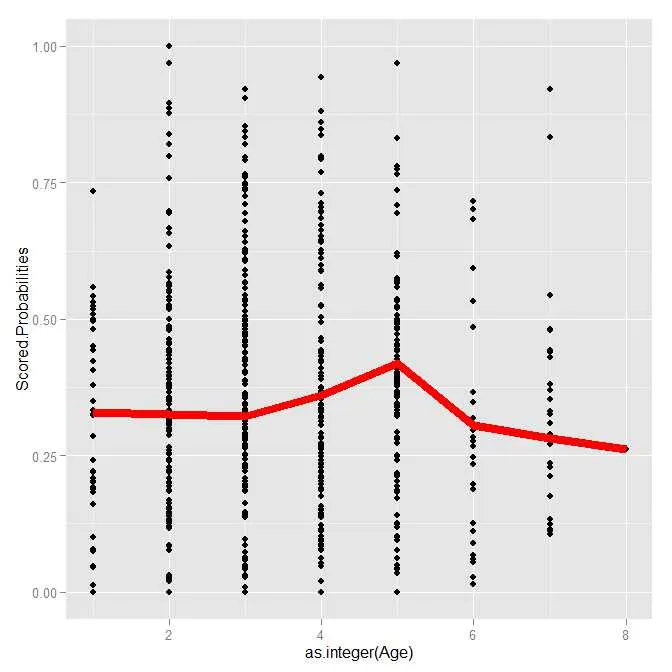
c <- ggplot(dataset1, aes(x=Age, y=Scored.Probabilities))
c + stat_smooth()
error: geom_smooth: Only one unique x value each group. Maybe you want aes(group = 1)?
如何解决这个问题?
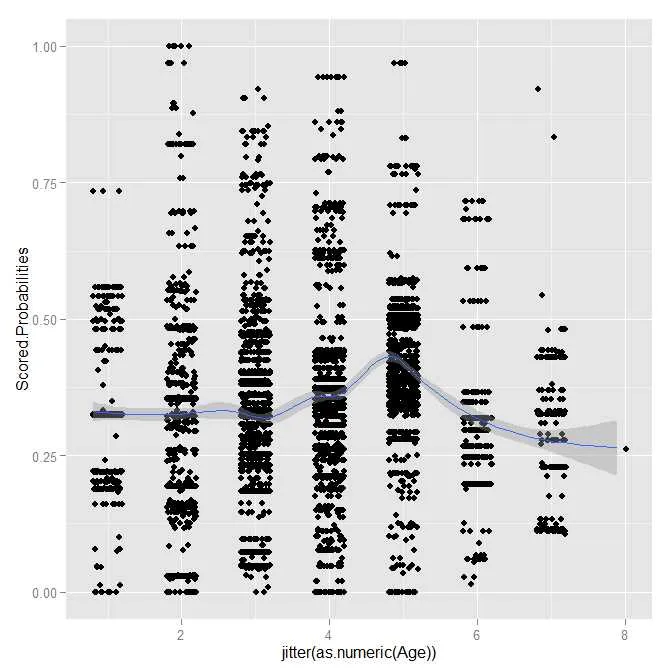
stat_smooth只能处理连续型变量。您的age变量是字符型变量。我只能假设time变量也不是保存为时间格式,而是字符型变量。您首先需要以有意义的方式将变量转换为数值型。 - shadow