我有一个名为plotmonthly2的函数,它使用ggplot2包来图形化显示我的数据的月度发展情况。
plotmonthly2:
plotmonthly2 <- function (my_data) {

  ymin <- 0
  ymax <- max(my_data[my_data[6] == unique(my_data[,6])[1], 4])+max(my_data[my_data[6] == unique(my_data[,6])[2], 4])

  ggplot(my_data, aes( Cat, value)) +
    geom_area(aes(fill= type), position = 'stack') +
    scale_y_continuous(expand = c(0,0), limits = c(ymin,ymax)) +
    scale_fill_manual(values = c("#797978", "#a6a4a1")) +
    scale_x_discrete(expand = c(0,0), labels = gsub(" 20"," ",my_data$monthYear)) +
    theme(axis.text.x = element_text(angle=90, vjust=1, face="bold", size=7, colour = "#016576"),
          axis.title = element_blank(),
          axis.text.y = element_blank(),
          axis.ticks=element_blank(),
          axis.line.x = element_line(color="black", size = 2),
          panel.background = element_rect(fill = "transparent",colour = NA),
          panel.grid.minor = element_blank(),
          panel.grid.major = element_blank(),
          legend.position = "none",
          plot.background = element_rect(fill = "transparent",colour = NA))
}
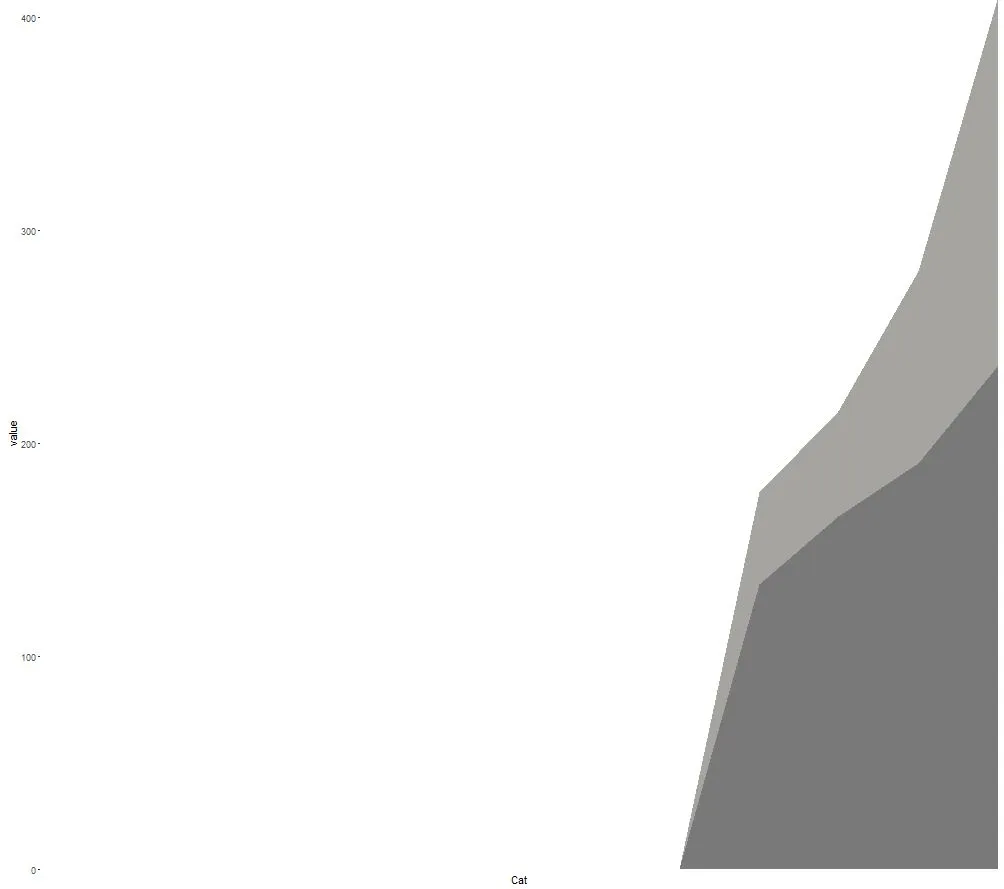
然而,当我绘制数据框时,x轴标签没有显示:
pmKM <- plotmonthly2(monthlyKMDef)
这是我的数据框的结构:

> dput(monthlyKMDef)
monthlyKMDef <- structure(list(month = c("Mai", "Jun", "Jul", "Aug", "Sep", "Okt",
"Nov", "Dez", "Jan", "Feb", "Mrz", "Apr", "Mai", "Mai", "Jun",
"Jul", "Aug", "Sep", "Okt", "Nov", "Dez", "Jan", "Feb", "Mrz",
"Apr", "Mai"), year = c("2015", "2015", "2015", "2015", "2015",
"2015", "2015", "2015", "2016", "2016", "2016", "2016", "2016",
"2015", "2015", "2015", "2015", "2015", "2015", "2015", "2015",
"2016", "2016", "2016", "2016", "2016"), variable = structure(c(1L,
1L, 1L, 1L, 1L, 1L, 1L, 1L, 1L, 1L, 1L, 1L, 1L, 1L, 1L, 1L, 1L,
1L, 1L, 1L, 1L, 1L, 1L, 1L, 1L, 1L), .Label = "Count", class = "factor"),
    value = c(0, 0, 0, 0, 0, 0, 0, 0, 0, 134, 166, 191, 237,
    0, 0, 0, 0, 0, 0, 0, 0, 0, 43, 49, 90, 173), monthYear = structure(c(2015.33333333333,
    2015.41666666667, 2015.5, 2015.58333333333, 2015.66666666667,
    2015.75, 2015.83333333333, 2015.91666666667, 2016, 2016.08333333333,
    2016.16666666667, 2016.25, 2016.33333333333, 2015.33333333333,
    2015.41666666667, 2015.5, 2015.58333333333, 2015.66666666667,
    2015.75, 2015.83333333333, 2015.91666666667, 2016, 2016.08333333333,
    2016.16666666667, 2016.25, 2016.33333333333), class = "yearmon"),
    type = c("Eigene", "Eigene", "Eigene", "Eigene", "Eigene",
    "Eigene", "Eigene", "Eigene", "Eigene", "Eigene", "Eigene",
    "Eigene", "Eigene", "Mentions", "Mentions", "Mentions", "Mentions",
    "Mentions", "Mentions", "Mentions", "Mentions", "Mentions",
    "Mentions", "Mentions", "Mentions", "Mentions"), Cat = c(1L,
    2L, 3L, 4L, 5L, 6L, 7L, 8L, 9L, 10L, 11L, 12L, 13L, 1L, 2L,
    3L, 4L, 5L, 6L, 7L, 8L, 9L, 10L, 11L, 12L, 13L)), .Names = c("month",
"year", "variable", "value", "monthYear", "type", "Cat"), row.names = c(NA,
-26L), class = "data.frame")
无论我如何反复检查函数,我仍然无法找到为什么轴未显示的原因。有人能看出问题在哪里吗?
scale_x_discrete,而数据不是离散的。我建议将monthYear变量转换为日期格式(使用as.Date或者lubridate中的某个函数),这样ggplot就可以很好地处理它了。 - Richard Telford