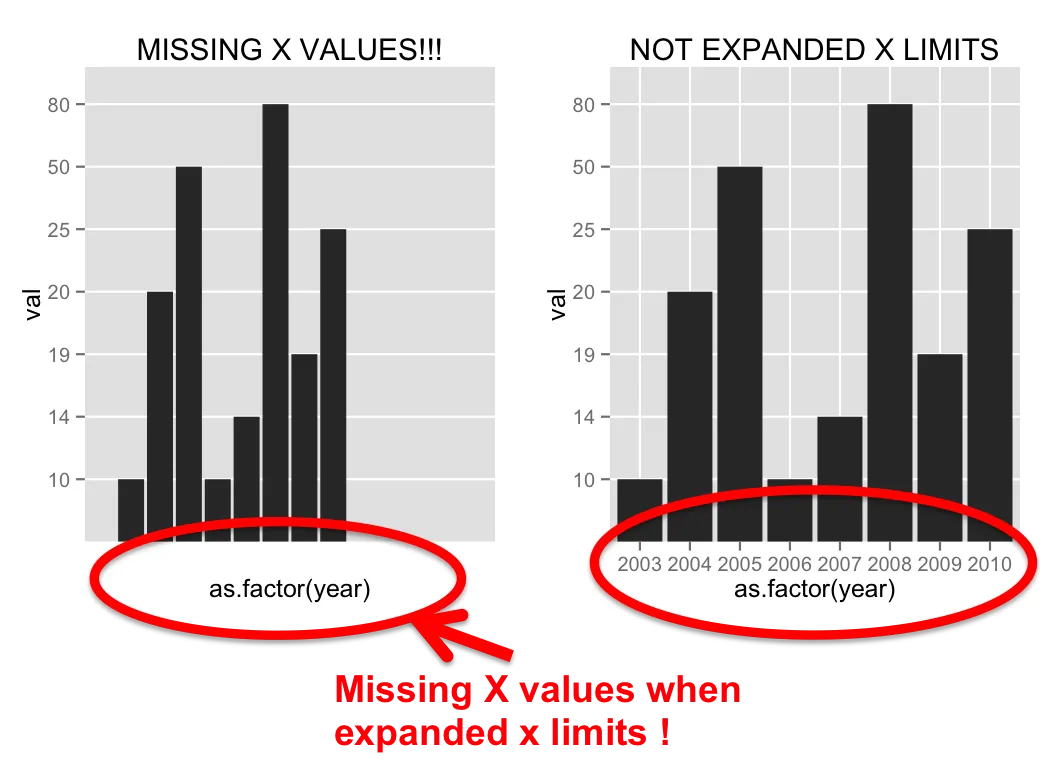
我想我的问题很琐碎,但我无法解决它。我有一年的数据,我想使用ggplot2 barplot来显示。由于第一年的条形图太靠近y轴,我想扩展x轴的限制。然而,如果应用,我的X轴值会消失,即使theme()规范也无法产生结果...我不明白为什么?原因可能是我使用"years"作为因子吗?但对于条形图表示,我需要使用离散刻度...谢谢!
# reproductible exemple

year<-c(2003:2010)
manag<-rep(c("A", "B"), 4)
np<-rep(c(0,1), each = 4)
val<- c(10,20,50,10,14,80,19,25)

df<-data.frame(cbind(year,
                     manag, np, val))

require(ggplot2)

a<-ggplot(data = df, aes(x = as.factor(year), y = val)) +
  ggtitle("MISSING X VALUES!!!") +
  geom_bar(stat = "identity") +
  scale_x_discrete(limits= c(2002:2015))
  # theme(axis.text.x=element_text(size = 8, colour = "black", angle = 90)

b<-ggplot(data = df, aes(x = as.factor(year), y = val)) +
  geom_bar(stat = "identity") +
  ggtitle("NOT EXPANDED X LIMITS")

grid.arrange(a, b, ncol = 2)
geom_rect类似的问题,即在绘图中将离散的x轴因子级别转换为as.numeric,以便我可以微调位置,但随后调用scale_x_discrete使其再次显示为离散。然而,x轴值消失了,直到我在scale_x_discrete中设置limits参数为原始轴标签的字符向量时才恢复;设置labels无效。 - user5359531