从Plot vectors of different length with ggplot2得到了我的线条图。
ggplot(plotData, aes(x, y, label=label, group=label)) + geom_line() + stat_smooth()
但是这只能使每行都变得平滑。我该如何平滑所有数据点?
从Plot vectors of different length with ggplot2得到了我的线条图。
ggplot(plotData, aes(x, y, label=label, group=label)) + geom_line() + stat_smooth()
但是这只能使每行都变得平滑。我该如何平滑所有数据点?
ggplot(plotData, aes(x, y, label=label, group=label)) +
    geom_line() +
    geom_smooth(aes(group = 1))
应该这样做。这里的想法是提供一个新的组美学,以便拟合平滑器基于所有数据,而不是基于 group=label 美学。
根据 @Andrie 的答案 的示例,我建议进行修改:
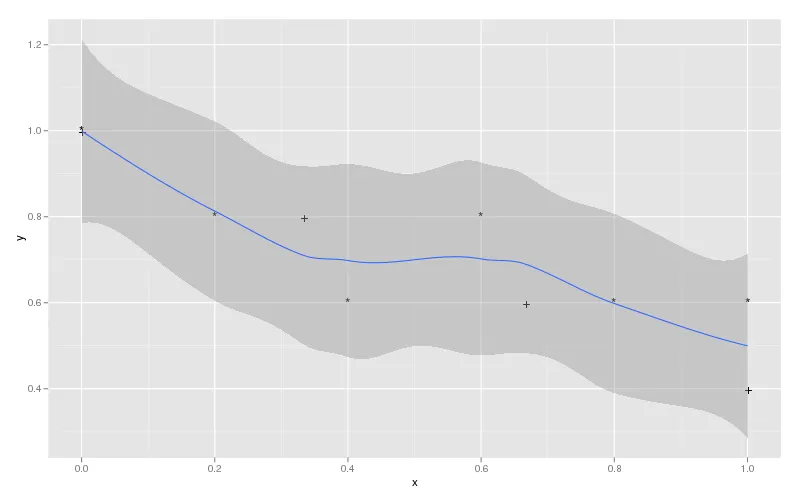
ggplot(plotData, aes(x, y, label=label, group=label)) +
    geom_text() +
    geom_smooth(aes(group = 1))
这将产生以下结果: