非常感谢您的建议和评论。
事实上,我的疏忽导致遗漏了
alphahull包。
在使用
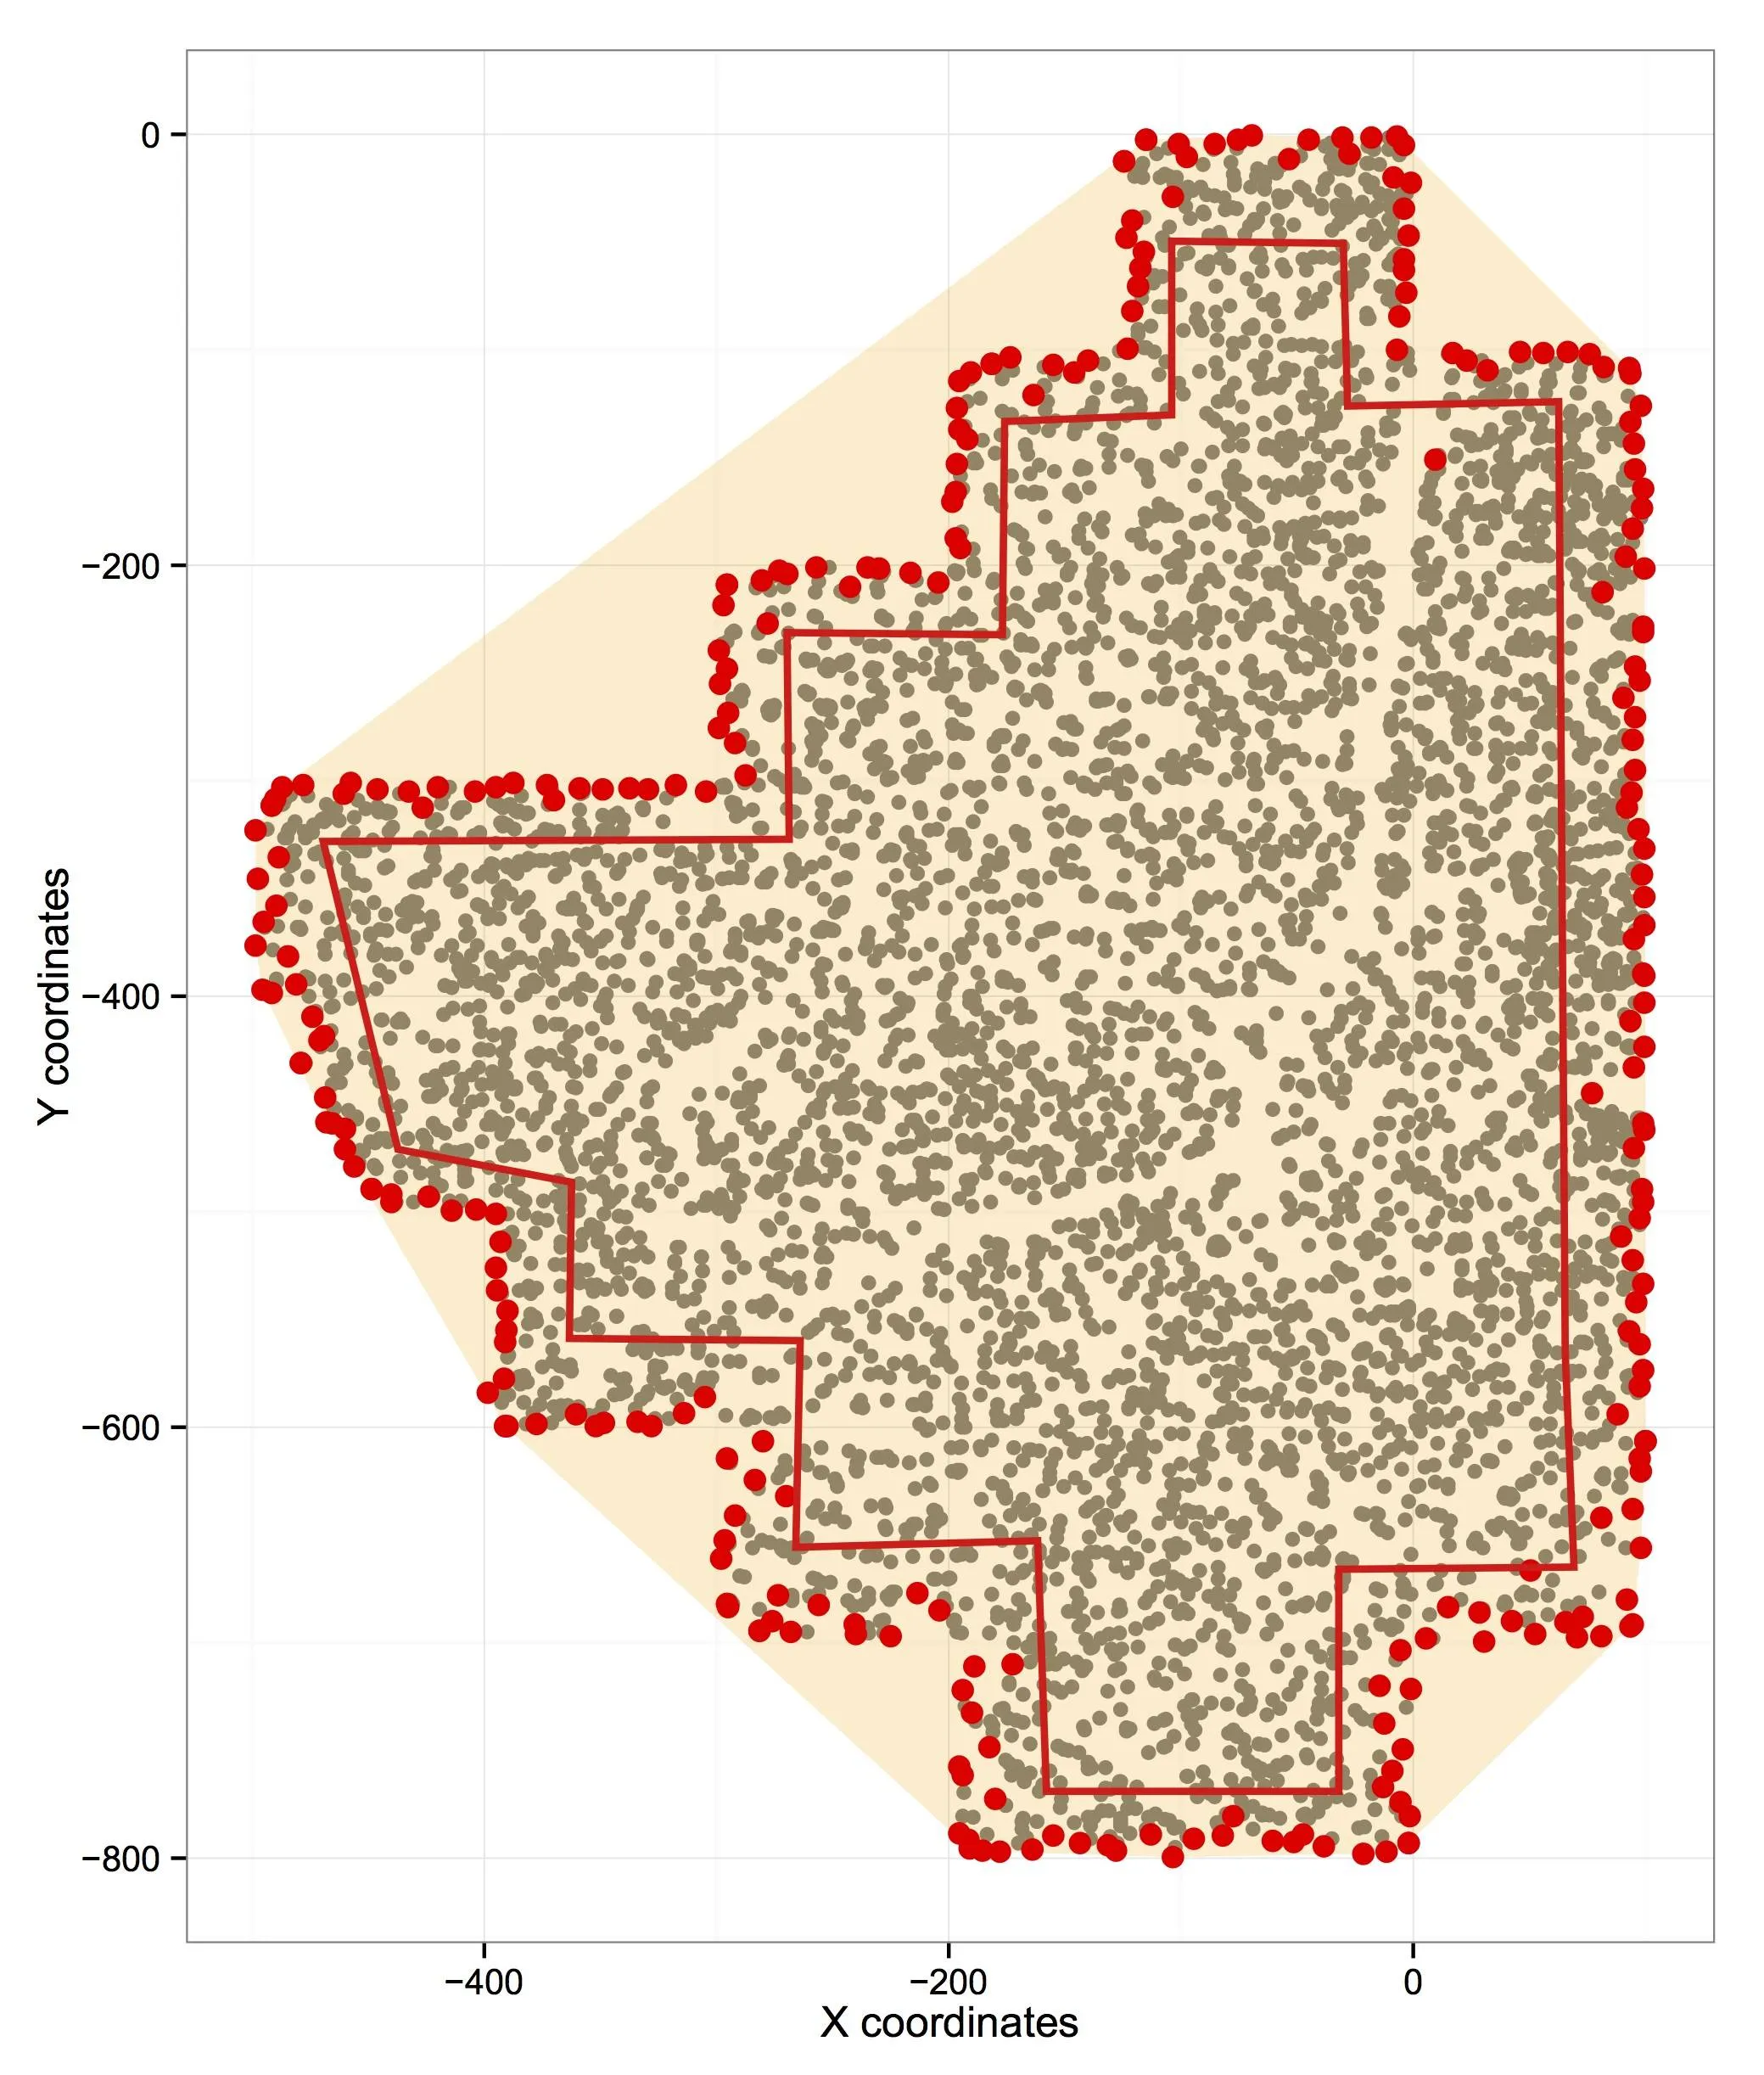
ashape识别边界后,我创建了一个缓冲多边形,并确定了位于缓冲区内外的数据。挑战是正确地从
ashap中提取多边形,但
RPubs的解决方案帮助了我。
您可以在
这里看到图形示例。
最好的祝愿
library(ggplot2); library(alphahull);
library(igraph); library(rgeos)
data.df<-read.csv("Data/Cencus/Lyford_meta.csv",sep=",",header=TRUE)
data <- data.df[!duplicated(paste(data.df$xsite, data.df$ysite, sep ="_")), c("xsite","ysite") ]
data.chull <- ashape(data, alpha = 20)
order.chull <- graph.edgelist(cbind(as.character(data.chull$edges[, "ind1"]), as.character(data.chull$edges[,"ind2"])), directed = FALSE)
cutg <- order.chull - E(order.chull)[1]
ends <- names(which(degree(cutg) == 1))
path <- get.shortest.paths(cutg, ends[1], ends[2])[[1]]
pathX <- as.numeric(V(order.chull)[unlist(path[[1]])]$name)
pathX = c(pathX, pathX[1])
data.chull <- as.data.frame(data.chull$x[pathX, ])
data.chull.poly <- SpatialPolygons(list(Polygons(list(Polygon(as.matrix(data.chull))),"s1")))
data.chull.poly.buff <- gBuffer(data.chull.poly, width = -10)
data.buffer <- fortify(data.chull.poly.buff)[c("long","lat")]
data$posit <- "Outside"
data$posit[point.in.polygon(data$x,data$y,data.buffer$long,data.buffer$lat) %in% c(1,2,3)] <- "Inside"
ggplot()+
theme_bw()+xlab("X coordinates (m)")+ylab("Y coordinates (m)") +
geom_point(data = data, aes(xsite, ysite, color = posit))+
geom_polygon(data = data.chull, aes(V1, V2), color = "black", alpha = 0)+
geom_polygon(data = data.buffer, aes(long, lat), color = "blue", alpha = 0)
chull正常工作。你只是不想让你的 hull 成为“凸形”。 - IRTFM