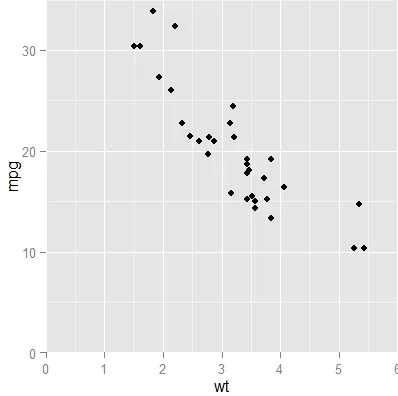
我该如何在ggplot2中删除x轴和y轴下方的绘图区域(见下面的示例)。我尝试了几个主题元素(panel.border,panel.margin,plot.margin),但都没有成功。
p <- ggplot(mtcars, aes(x = wt, y = mpg,xmin=0,ymin=0)) + geom_point()
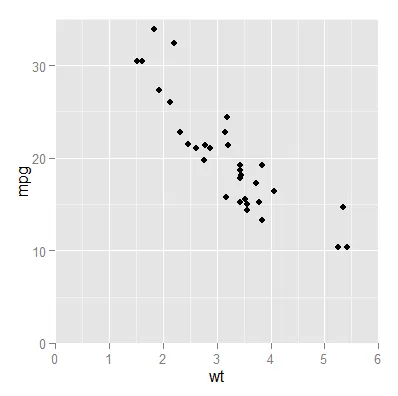
使用连续比例美学中的expand参数...
p <- ggplot(mtcars, aes(x = wt, y = mpg,xmin=0,ymin=0)) +
geom_point()+
scale_x_continuous( expand = c(0,0) , limits = c(0,6) )+
scale_y_continuous( expand = c(0,0), limits = c(0,35) )
设置限制以避免截断极端值。
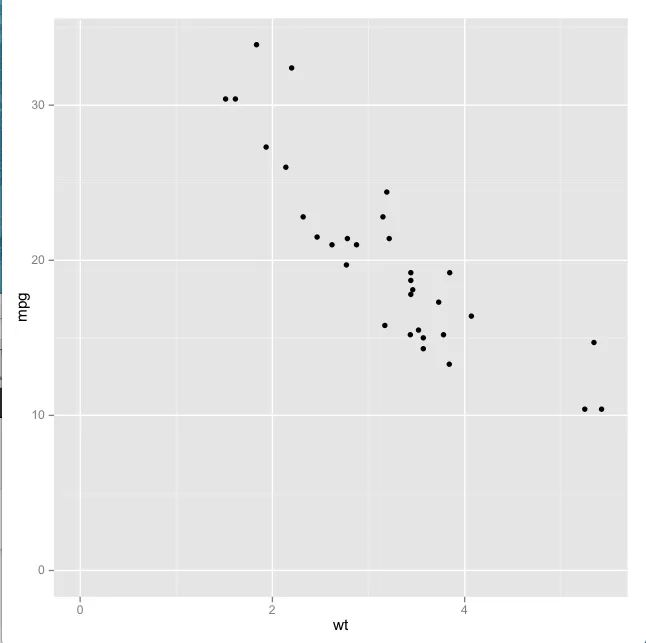
但是,如果您想在整个图周围没有边距,则需要使用theme元素plot.margin,如下所示(请注意,在下面的图中,极右侧被截断为零)。
require(grid) # for unit
p + theme( plot.margin = unit( c(0,0,0,0) , "in" ) )