我有像这样的数据,df_Filtered:
Product Relative_Value
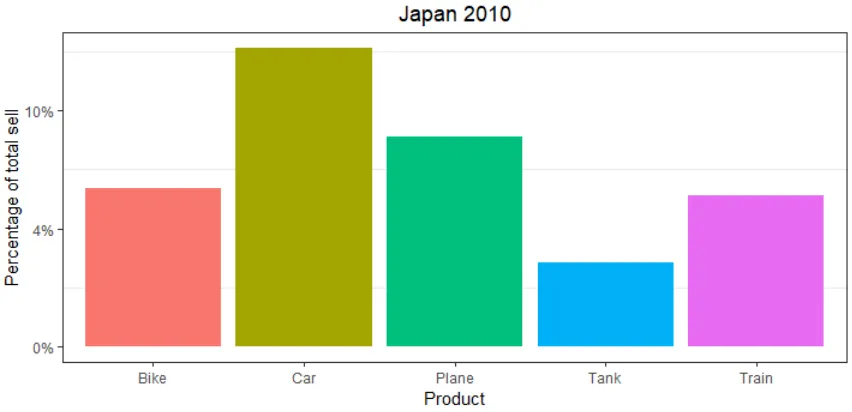
Car 0.12651458
Plane 0.08888552
Tank 0.03546231
Bike 0.06711630
Train 0.06382191
我想用GGplot2制作数据的条形图:
ggplot(df_Filtered, aes(x = Product, y = Relative_Value, fill = Product)) +
    scale_y_continuous(labels = scales::percent) +
    geom_bar(stat = "identity") +
    theme_bw() +
    theme(plot.background = element_rect(colour = "black", size = 1)) +
    theme(legend.position = "none") +
    theme(plot.title = element_text(hjust = 0.5))
    labs(x ="Product", y = "Percentage of total sell", title = "Japan 2010") +
    theme(panel.grid.major = element_blank())
如何在图表的y轴上去掉小数点?这样它会显示20 %而不是20.0 %?
scale_y_continuous(breaks = seq(0,1,0.05), labels = paste0(seq(0,1,0.05)*100," %"))代替。 - AntoniosKylim函数中使用了(固定)值,才会出现您描述的问题,因为这会固定y轴范围。 - AntoniosK