为了我在大学的一个项目部分,我正在尝试使用Python重新创建地球,并使用它来绘制特定位置的点,并绘制各种方向的圆,以便与我拥有的卫星数据对齐,以便从数据集中给出飞机在给定时间的位置表示。
我开始时只是绘制了一个线框,并在线框上绘制了我需要的点(都按照地球的比例和地理位置)。
我遇到的问题是,当我在一个类似球体的对象上绘制点,并在其上叠加地球的图像时,当旋转球体超过一定点时,这些点会消失。所以,首先的问题是:我如何防止它们消失?
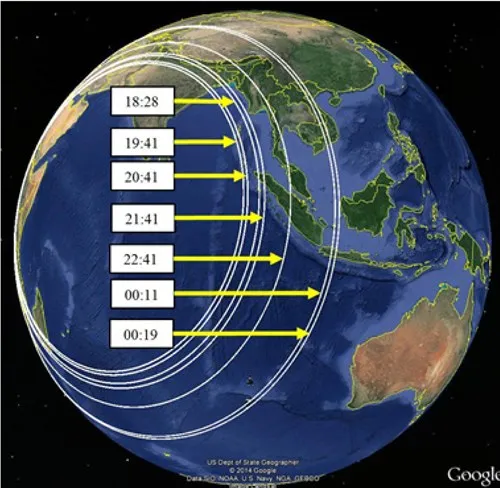
其次,我似乎找不到任何方法来绘制以球体为中心的圆圈 - 例如,绕赤道的圆圈,然后利用相同的思路在球体表面绘制圆圈,以得到下面这样的图像:
我的当前代码是:
如果有办法让点不再消失,并且在赤道上绘制一个圆圈,那就太好了!谢谢!
我开始时只是绘制了一个线框,并在线框上绘制了我需要的点(都按照地球的比例和地理位置)。
我遇到的问题是,当我在一个类似球体的对象上绘制点,并在其上叠加地球的图像时,当旋转球体超过一定点时,这些点会消失。所以,首先的问题是:我如何防止它们消失?
其次,我似乎找不到任何方法来绘制以球体为中心的圆圈 - 例如,绕赤道的圆圈,然后利用相同的思路在球体表面绘制圆圈,以得到下面这样的图像:
我的当前代码是:
import numpy as np
import matplotlib.pyplot as plt
from mpl_toolkits.mplot3d import Axes3D
from itertools import product, combinations
import PIL

#Plot the Earth
f = plt.figure(1, figsize=(13,13))
ax = f.add_subplot(111, projection='3d')
u, v = np.mgrid[0:2*np.pi:30j, 0:np.pi:20j]
x=6371*np.cos(u)*np.sin(v)
y=6371*np.sin(u)*np.sin(v)
z=6371*np.cos(v)
ax.plot_wireframe(x, y, z, color="b")

#GES ground station @ Perth & AES @ KLIA

ax.scatter([-2368.8],[4881.1],[-3342.0],color="r",s=100)
ax.scatter([-1293.0],[6238.3],[303.5],color="k",s=100)

#Load earthmap with PIL
bm = PIL.Image.open('earthmap.jpg')
#It's big, so I'll rescale it, convert to array, and divide by 256 to get RGB values that matplotlib accept
bm = np.array(bm.resize([d/3 for d in bm.size]))/256.

#d/1 is normal size, anything else is smaller - faster loading time on Uni HPC

#Coordinates of the image - don't know if this is entirely accurate, but probably close
lons = np.linspace(-180, 180, bm.shape[1]) * np.pi/180
lats = np.linspace(-90, 90, bm.shape[0])[::-1] * np.pi/180

#Repeat code specifying face colours

x = np.outer(6371*np.cos(lons), np.cos(lats)).T
y = np.outer(6371*np.sin(lons), np.cos(lats)).T
z = np.outer(6371*np.ones(np.size(lons)), np.sin(lats)).T
ax.plot_surface(x, y, z, rstride=4, cstride=4, facecolors = bm)

plt.show()
如果有办法让点不再消失,并且在赤道上绘制一个圆圈,那就太好了!谢谢!
basemap,但是为了确认一下,你之前没有接触过吗?不确定它的旋转能力。然而,通过图像搜索,我发现了这个(相当差劲的)例子,它似乎展示了一个basemap投影在一个交互式的matplotlib窗口中。 - roganjosh