1个回答
9
如果您创建
参考
我在这里做的是让绘图部分调用
在创建
QuTip的Bloch类的子类,并更改其绘制球的方式,则可以绘制密度图并保留它创建的所有其他框架。参考
matplotlib surface_plot 示例 ,修改Bloch类的绘图函数即可。将其放在您自己的子类中可避免对库进行任何修改。from qutip import Bloch
from math import sqrt, sin, cos, pi
from colorsys import hsv_to_rgb
from numpy import linspace, outer, ones, sin, cos, arccos, arctan2, size, empty
class BlochDensity(Bloch):
def plot_back(self):
# back half of sphere
u = linspace(0, pi, 25)
v = linspace(0, pi, 25)
x = outer(cos(u), sin(v))
y = outer(sin(u), sin(v))
z = outer(ones(size(u)), cos(v))
colours = empty(x.shape, dtype=object)
for i in range(len(x)):
for j in range(len(y)):
theta = arctan2(y[i,j], x[i,j])
phi = arccos(z[i,j])
colours[i,j] = self.density(theta, phi)
self.axes.plot_surface(x, y, z, rstride=1, cstride=1,
facecolors=colours,
alpha=self.sphere_alpha,
linewidth=0, antialiased=True)
# wireframe
self.axes.plot_wireframe(x, y, z, rstride=5, cstride=5,
color=self.frame_color,
alpha=self.frame_alpha)
# equator
self.axes.plot(1.0 * cos(u), 1.0 * sin(u), zs=0, zdir='z',
lw=self.frame_width, color=self.frame_color)
self.axes.plot(1.0 * cos(u), 1.0 * sin(u), zs=0, zdir='x',
lw=self.frame_width, color=self.frame_color)
def plot_front(self):
# front half of sphere
u = linspace(-pi, 0, 25)
v = linspace(0, pi, 25)
x = outer(cos(u), sin(v))
y = outer(sin(u), sin(v))
z = outer(ones(size(u)), cos(v))
colours = empty(x.shape, dtype=object)
for i in range(len(x)):
for j in range(len(y)):
theta = arctan2(y[i,j], x[i,j])
phi = arccos(z[i,j])
colours[i,j] = self.density(theta, phi)
self.axes.plot_surface(x, y, z, rstride=1, cstride=1,
facecolors=colours,
alpha=self.sphere_alpha,
linewidth=0, antialiased=True)
# wireframe
self.axes.plot_wireframe(x, y, z, rstride=5, cstride=5,
color=self.frame_color,
alpha=self.frame_alpha)
# equator
self.axes.plot(1.0 * cos(u), 1.0 * sin(u),
zs=0, zdir='z', lw=self.frame_width,
color=self.frame_color)
self.axes.plot(1.0 * cos(u), 1.0 * sin(u),
zs=0, zdir='x', lw=self.frame_width,
color=self.frame_color)
我在这里做的是让绘图部分调用
BlochDensity的函数:self.density(theta,phi) - 我还没有定义。在创建
BlochDensity对象之后,需要创建该函数,该函数将theta, phi映射到您的密度上。建议使用SciPy的2D插值来创建该函数,类似于以下内容:from scipy.interpolate import interp2d
from numpy.random import rand
b = BlochDensity()
b.sphere_alpha=0.5
thetas, phis = linspace(-pi,pi,10), linspace(0,pi,10)
density = rand(len(thetas), len(phis))
#scale density to a maximum of 1
density /= density.max()
interpolated_density = interp2d(thetas, phis, density)
def f(theta, phi):
return hsv_to_rgb(interpolated_density(theta,phi), 1, 1)
b.density = f
b.show()
b.density = f
b.show()
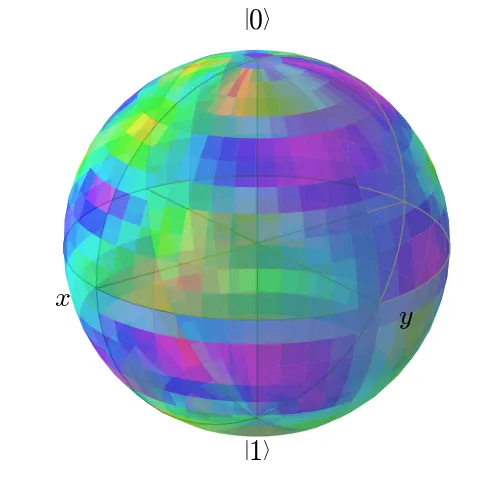
如果您想增加分辨率,只需在BlochDensity的plot_*函数中更改linspace中的数字即可。
- will
1
1刚刚意识到底部的演示图查看密度图会更好,如果linspace中的值较小,则会减少波峰。尝试减少它以查看效果。 - will
网页内容由stack overflow 提供, 点击上面的可以查看英文原文,
原文链接
原文链接
Bloch类来实现这个功能 - 它使用了plot_surface,这意味着你可以传递一个"face_colors"关键字参数,并自己设置面的颜色。你是想要得到像这样的图吗? - will