这个答案并不完美,但希望足以让您建立起来。
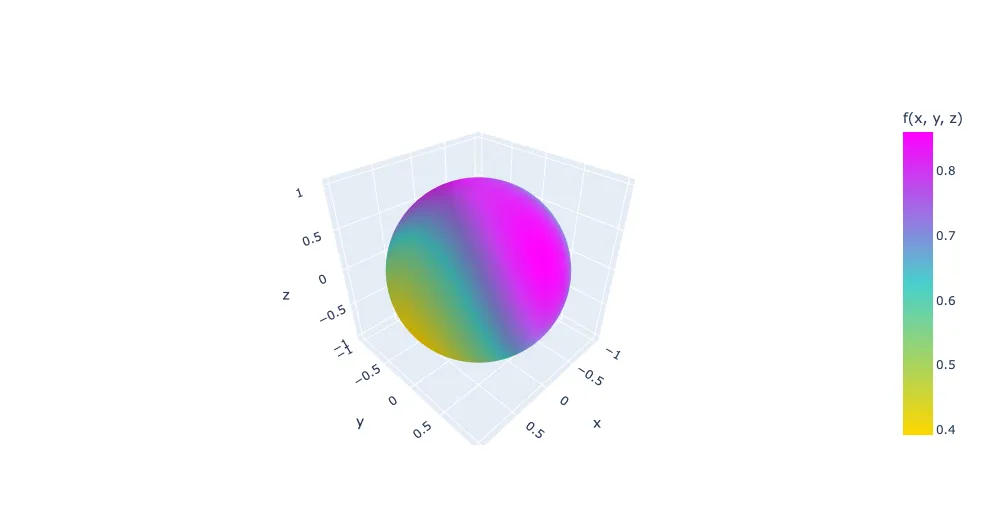
对于球本身,我不知道在plotly中是否有任何“捷径”来做这样的事情,因此我的方法是手动创建一个球体网格。生成顶点很简单,例如像你所做的那样 - 稍微棘手的部分是找出三角形的顶点索引(这取决于顶点生成方案)。有各种算法可以平滑地完成这项工作(即生成没有“尖端”的球体),我只是为了演示而编写了一些粗略的代码。然后我们可以使用Mesh3d对象来显示球体以及强度和您选择的颜色映射:
N = 100
theta, z = np.meshgrid(np.linspace(-np.pi, np.pi, N), np.linspace(-1, 1, N))
r = np.sqrt(1 - z ** 2)
x = r * np.cos(theta)
y = r * np.sin(theta)
x = x.ravel()
y = y.ravel()
z = z.ravel()
indices = np.arange(N * (N - 1) - 1)
i1 = np.concatenate([indices, (indices // N + 1) * N + (indices + 1) % N])
i2 = np.concatenate([indices + N, indices // N * N + (indices + 1) % N])
i3 = np.concatenate([(indices // N + 1) * N + (indices + 1) % N, indices])
def f(x, y, z):
return (np.cos(x * 2) + np.sin(y ** 2) + np.sin(z) + 3) / 6
fig = go.Figure(data=[
go.Mesh3d(
x=x,
y=y,
z=z,
colorbar_title='f(x, y, z)',
colorscale=[[0, 'gold'],
[0.5, 'mediumturquoise'],
[1, 'magenta']],
intensity = f(x, y, z),
i = i1,
j = i2,
k = i3,
name='y',
showscale=True
)
])
fig.show()
这将产生以下交互式图表:
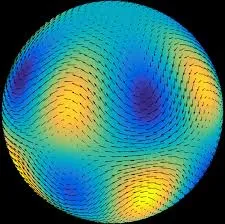
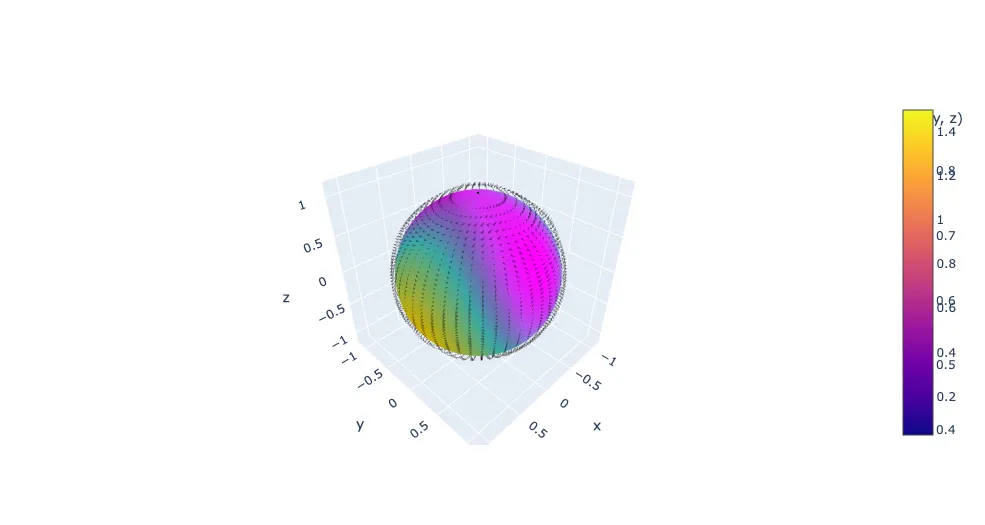
要添加向量场,您可以使用
Cone plot; 这需要一些调整,因为当我只在与球体相同的
x, y, z位置绘制锥体时,有些锥体会被球体部分或完全遮挡。因此,我生成了另一个半径略大的球体,并将锥体放置在那里。我还尝试了一些光照参数,使其像您示例中的黑色。完整代码如下:
N = 100
theta, z = np.meshgrid(np.linspace(-np.pi, np.pi, N), np.linspace(-1, 1, N))
r = np.sqrt(1 - z ** 2)
x = r * np.cos(theta)
y = r * np.sin(theta)
x = x.ravel()
y = y.ravel()
z = z.ravel()
indices = np.arange(N * (N - 1) - 1)
i1 = np.concatenate([indices, (indices // N + 1) * N + (indices + 1) % N])
i2 = np.concatenate([indices + N, indices // N * N + (indices + 1) % N])
i3 = np.concatenate([(indices // N + 1) * N + (indices + 1) % N, indices])
def f(x, y, z):
return (np.cos(x * 2) + np.sin(y ** 2) + np.sin(z) + 3) / 6
def grad_f(x, y, z):
return np.stack([np.cos(3 * y + 5 * x),
np.sin(z * y),
np.cos(4 * x - 3 * y + z * 7)], axis=1)
N2 = 50
R2 = 1.05
theta2, z2 = np.meshgrid(np.linspace(-np.pi, np.pi, N2), np.linspace(-R2, R2, N2))
r2 = np.sqrt(R2 ** 2 - z2 ** 2)
x2 = r2 * np.cos(theta2)
y2 = r2 * np.sin(theta2)
x2 = x2.ravel()
y2 = y2.ravel()
z2 = z2.ravel()
uvw = grad_f(x2, y2, z2)
fig = go.Figure(data=[
go.Mesh3d(
x=x,
y=y,
z=z,
colorbar_title='f(x, y, z)',
colorscale=[[0, 'gold'],
[0.5, 'mediumturquoise'],
[1, 'magenta']],
intensity = f(x, y, z),
i = i1,
j = i2,
k = i3,
name='y',
showscale=True
),
go.Cone(
x=x2, y=y2, z=z2, u=uvw[:, 0], v=uvw[:, 1], w=uvw[:, 2], sizemode='absolute', sizeref=2, anchor='tail',
lighting_ambient=0, lighting_diffuse=0, opacity=.2
)
])
fig.show()
并生成了如下图所示的结果:
希望这可以帮助您。显示有很多调整,当然还有更好的构建球体网格的方法(例如参见这篇文章),因此在这方面有很大的自由度(尽管需要一些工作成本)。
祝你好运!