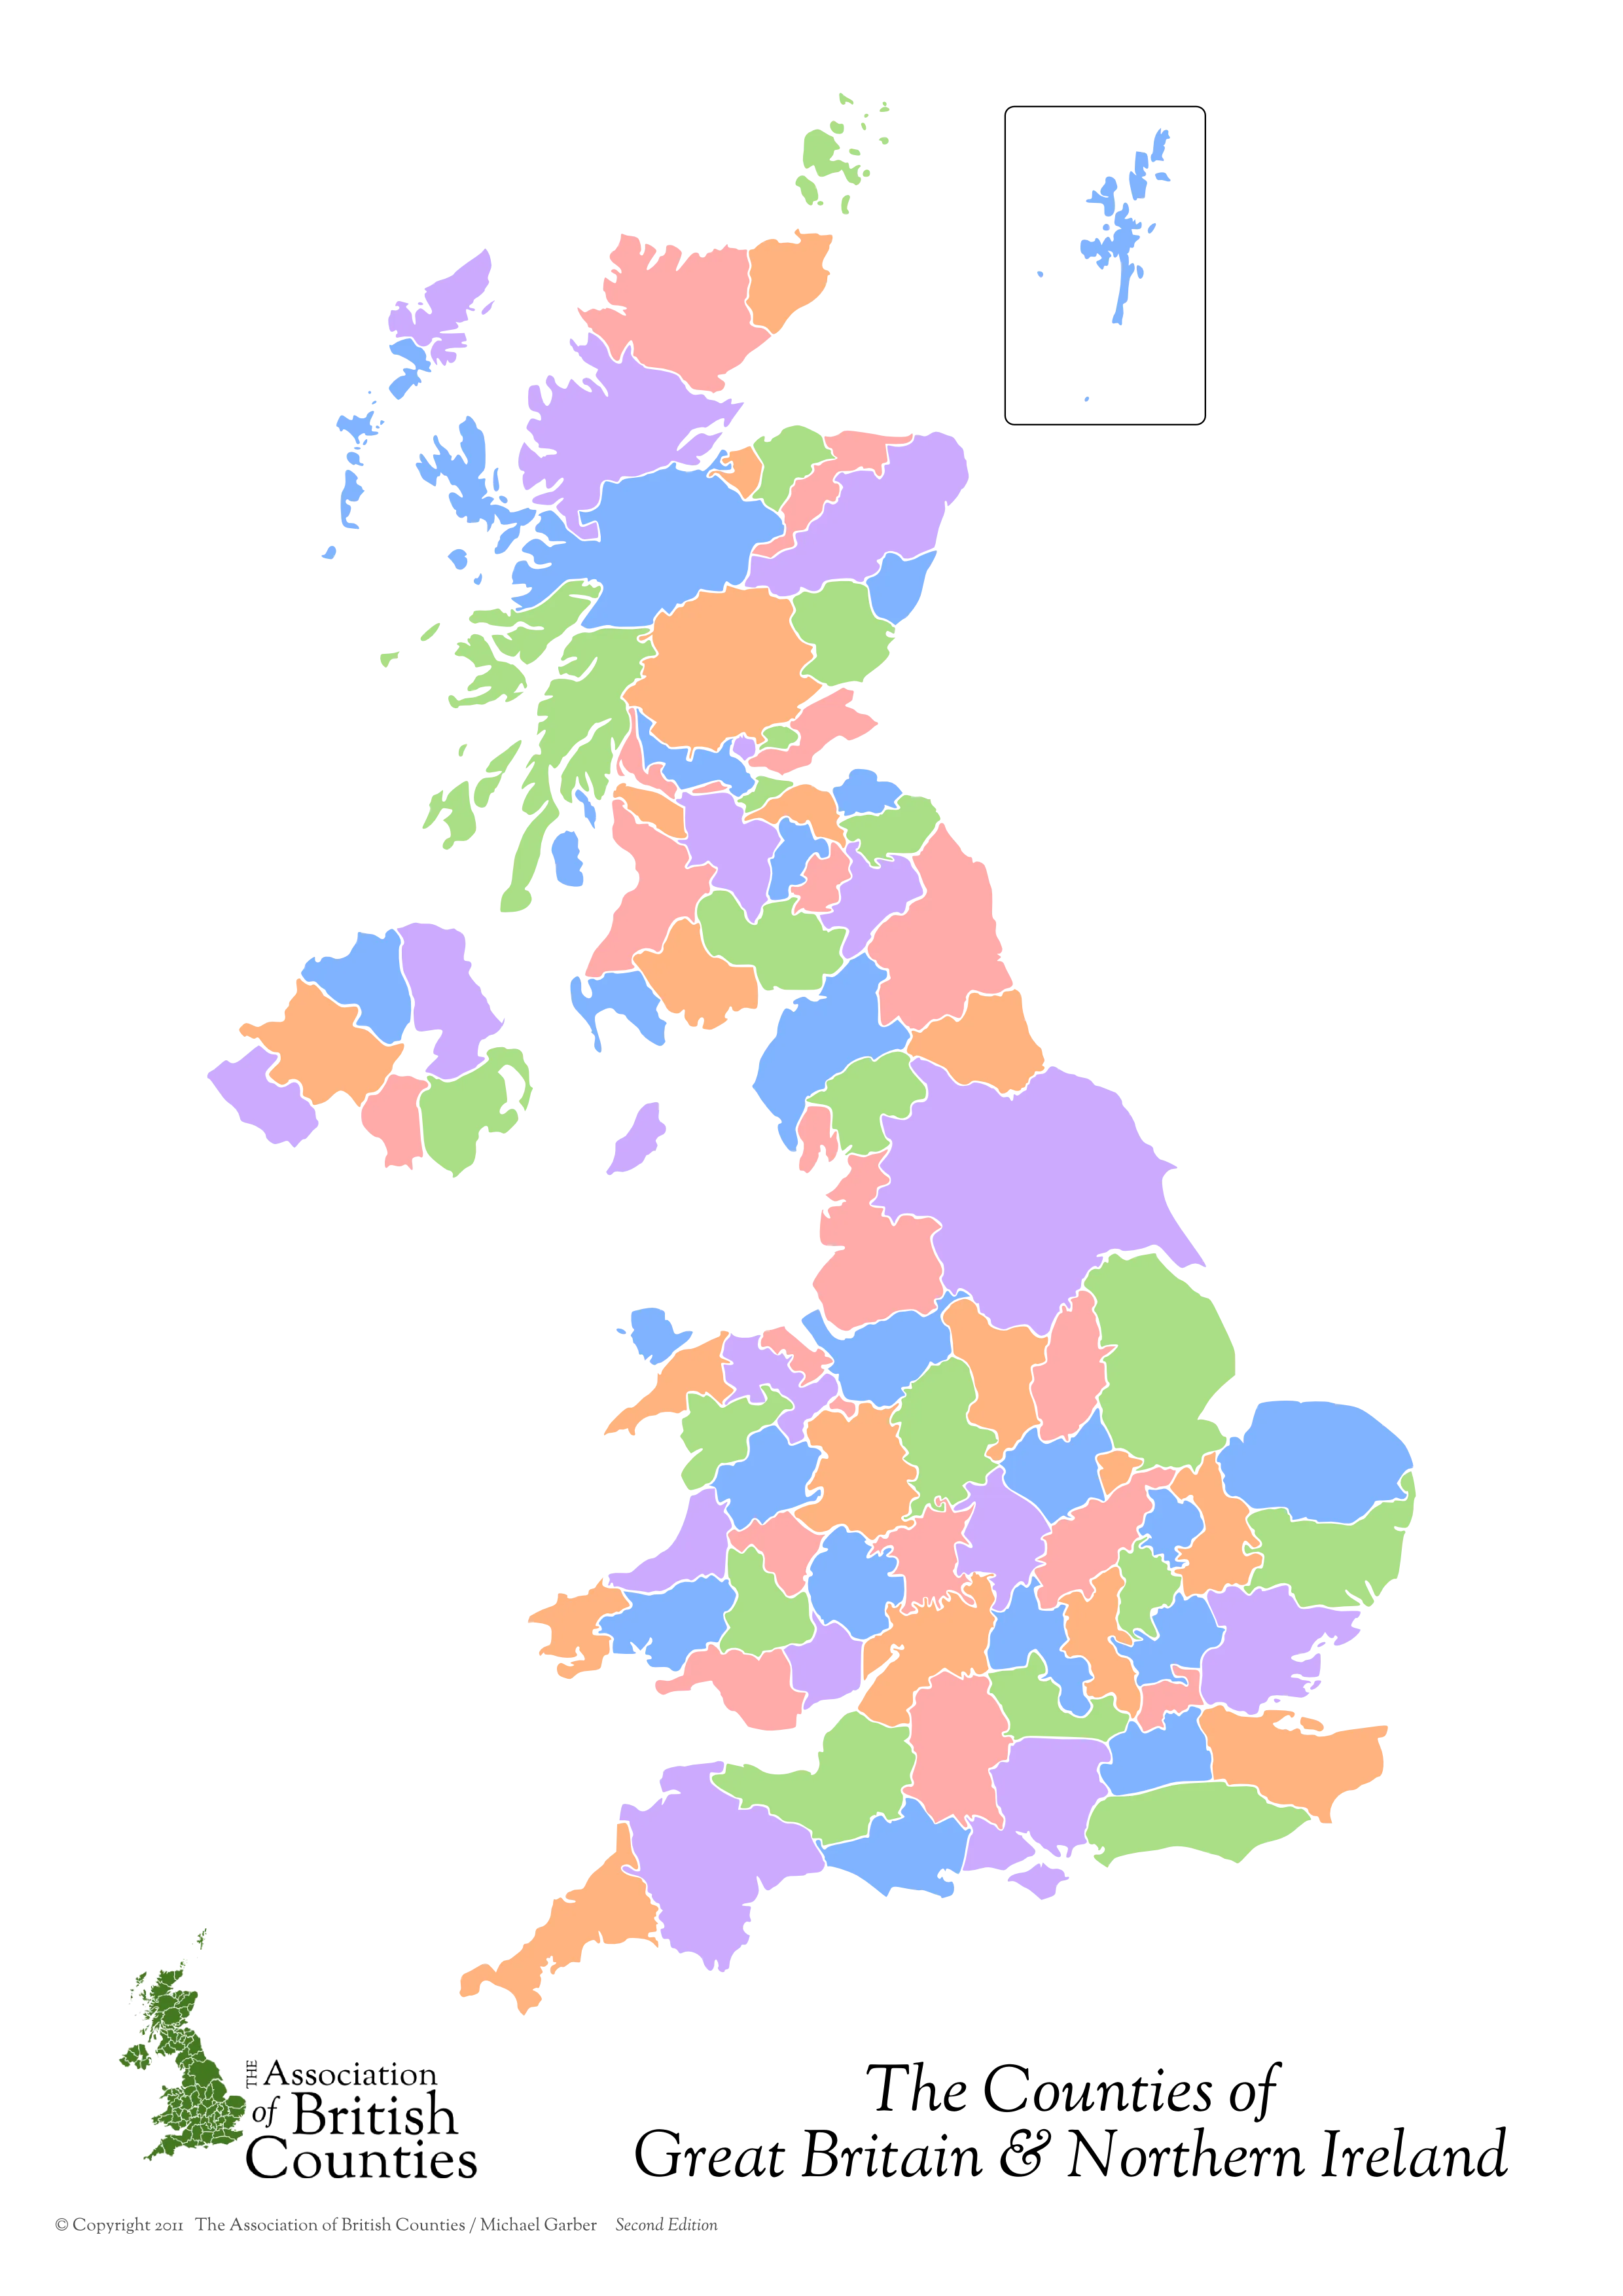
我想要可视化使用cv2.approxPolyDP()提取的多边形曲线。下面是我使用的图片:
我的代码尝试分离出主要岛屿,并定义并绘制轮廓近似和轮廓凸包。 我已经用绿色绘制了找到的轮廓,红色表示近似值:
import numpy as np
import cv2

# load image and shrink - it's massive
img = cv2.imread('../data/UK.png')
img = cv2.resize(img, None,fx=0.25, fy=0.25, interpolation = cv2.INTER_CUBIC)

# get a blank canvas for drawing contour on and convert img to grayscale
canvas = np.zeros(img.shape, np.uint8)
img2gray = cv2.cvtColor(img,cv2.COLOR_BGR2GRAY)

# filter out small lines between counties
kernel = np.ones((5,5),np.float32)/25
img2gray = cv2.filter2D(img2gray,-1,kernel)

# threshold the image and extract contours
ret,thresh = cv2.threshold(img2gray,250,255,cv2.THRESH_BINARY_INV)
im2,contours,hierarchy = cv2.findContours(thresh, cv2.RETR_TREE, cv2.CHAIN_APPROX_NONE)


# find the main island (biggest area)
cnt = contours[0]
max_area = cv2.contourArea(cnt)

for cont in contours:
    if cv2.contourArea(cont) > max_area:
        cnt = cont
        max_area = cv2.contourArea(cont)

# define main island contour approx. and hull
perimeter = cv2.arcLength(cnt,True)
epsilon = 0.01*cv2.arcLength(cnt,True)
approx = cv2.approxPolyDP(cnt,epsilon,True)

hull = cv2.convexHull(cnt)

# cv2.isContourConvex(cnt)

cv2.drawContours(canvas, cnt, -1, (0, 255, 0), 3)
cv2.drawContours(canvas, approx, -1, (0, 0, 255), 3)
## cv2.drawContours(canvas, hull, -1, (0, 0, 255), 3) # only displays a few points as well.

cv2.imshow("Contour", canvas)
k = cv2.waitKey(0)

if k == 27:         # wait for ESC key to exit
    cv2.destroyAllWindows()
以下是生成的图像:
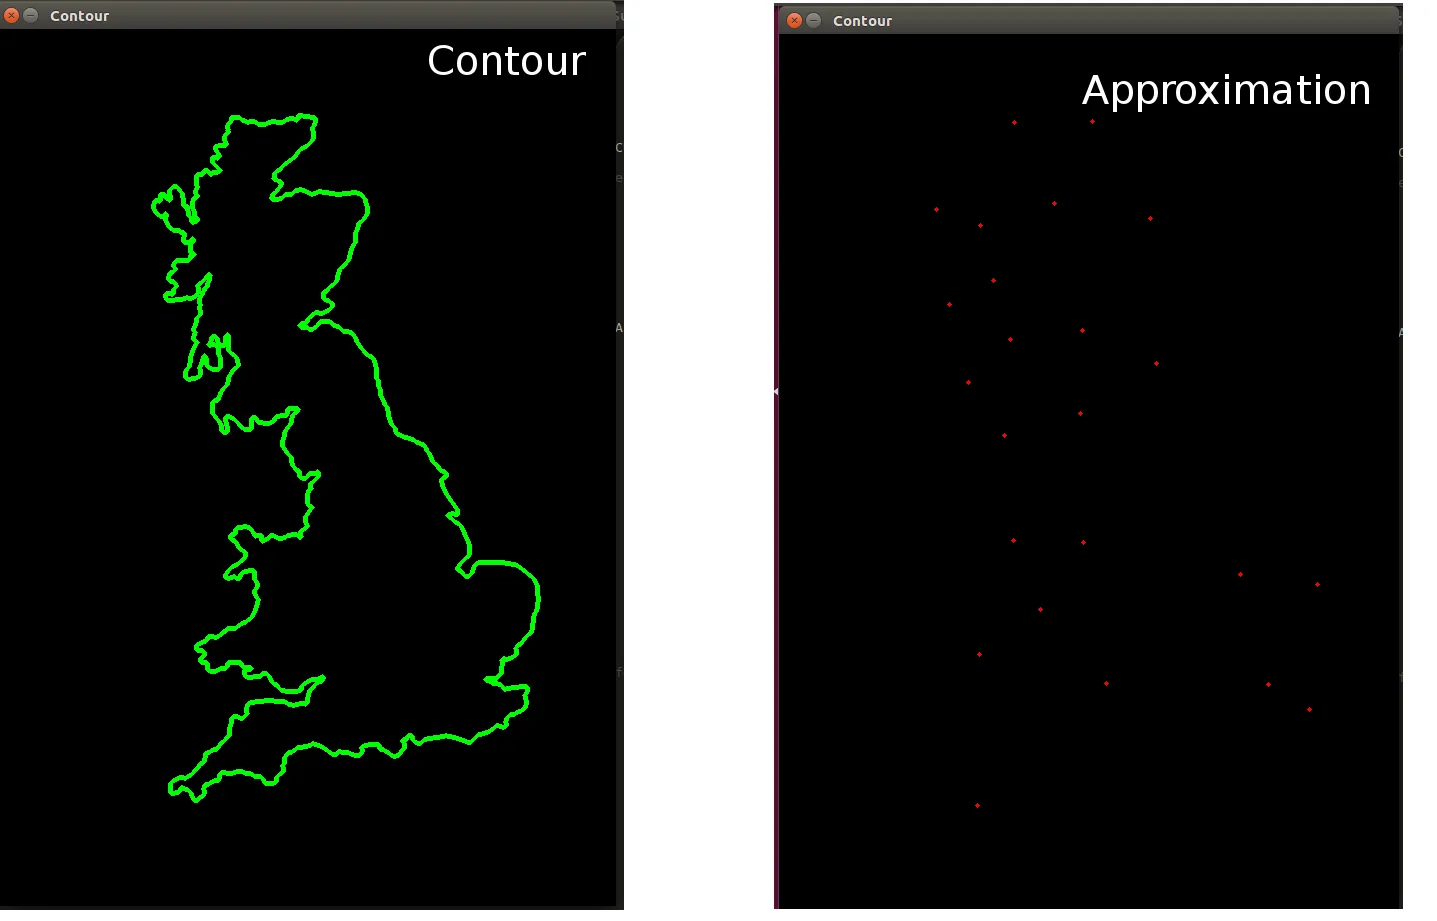
第一张图片以绿色绘制轮廓。第二张图用红色表示近似曲线 - 我如何将这个近似曲线画成一个连续的封闭曲线?
文档不是很清楚,教程也不是很清晰,但我的理解是,cv2.approxPolyDP()应该定义一个连续的封闭曲线,我应该能够用cv2.drawContours()绘制它。那么,如果是这样,我哪里做错了吗?
drawContours,如何将返回的点列表绘制为连续曲线? - AidenhjjdrawContours来绘制轮廓,但在你的代码中,你正在同一画布上绘制它们,然后显示一张图片,但你附加的图片是不同的!你能否请提供相关的代码?我还是认为这可能是由于自相交引起的。尝试绘制线条以找出问题所在。 - avtomatoncv2.polylines(canvas, approx, True, (255, 0, 255)),基本上可以得到相同的结果。 - Aidenhjj