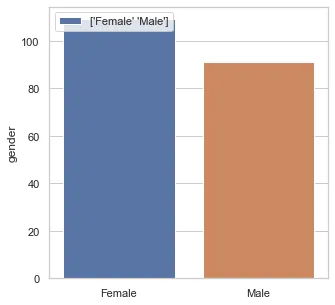
我正在尝试为我的seaborn条形图添加图例。我已经尝试添加色调,但出现错误,显示IndexingError: Unalignable boolean Series provided as indexer (index of the boolean Series and of the indexed object do not match).因此,我尝试了其他解决方案,通过给它标签参数。以下是代码:
plt.figure(figsize=[15,12])
sns.barplot(x=customer['gender'].unique(),y=customer.groupby(['gender'])['gender'].count(),
            data=customer,label=customer['gender'].unique())
plt.legend(loc="upper left")
这是结果,但结果是错误的。根据条形图中的颜色,应该有“女性”和“男性”标签。女性和男性应该用不同的颜色分开。我已经尝试过this, this和this,但都不起作用。我该怎么做?