图例中没有找到要放置的标签。

55

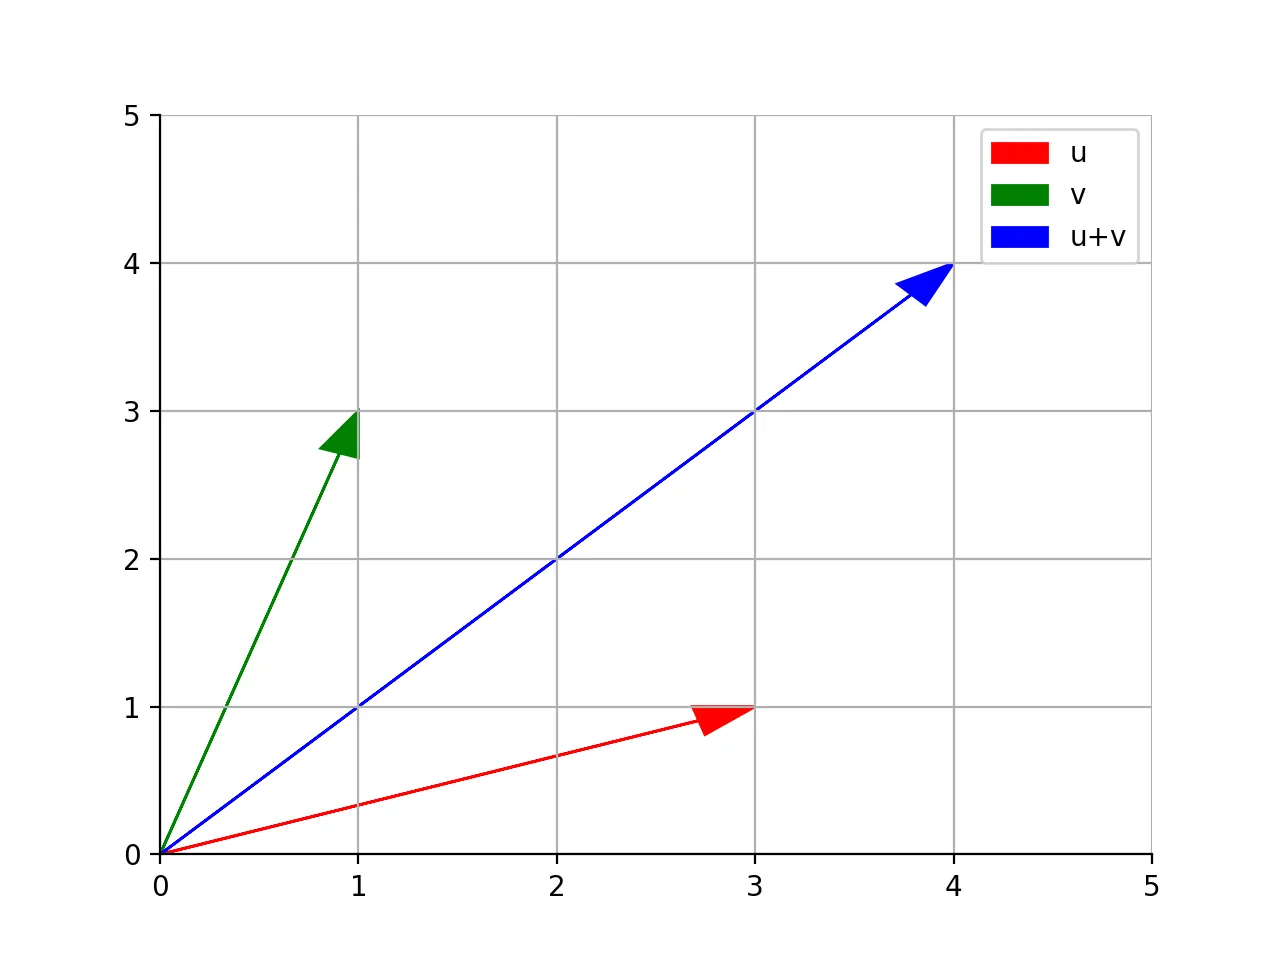
我正在尝试在PyPlot中创建一个平行四边形。首先,我要使用以下代码插入矢量箭头,而不是绘制平行四边形:

fig = plt.figure()
ax = fig.add_subplot(111)
ax.spines['left'].set_position('zero')
ax.spines['right'].set_color('none')
ax.spines['bottom'].set_position('zero')
ax.spines['top'].set_color('none')
plt.axis([-5,5,-5,5])
ax.xaxis.set_ticks_position('bottom')
ax.yaxis.set_ticks_position('left')
plt.grid()
plt.arrow(0,0, 3,1, head_width=0.2, color='r', length_includes_head=True, label='u')
plt.arrow(0,0, 1,3, head_width=0.2, color='r', length_includes_head=True, label='v')
plt.arrow(0,0, 4,4, head_width=0.2, color='r', length_includes_head=True, label='u+v')
plt.legend()

这会返回以下错误:

No handles with labels found to put in legend.

我不确定为什么,因为根据plt.arrow()的文档,label是一个可接受的关键字参数,plt.legend()应该可以读取它。图的其余部分绘制得很好;只是缺少图例。


由于某些原因,我无法重现这个错误。在包含导入语句之后,我可以运行此代码而没有任何错误,并且它显示了图例。 - akalanka
7个回答

55

可能有些晚了,但对于任何有相同问题的人来说,解决方案是使用方法legend()用于相应的ax而不是用于plt

fig = plt.figure()
ax = fig.add_subplot(111)
ax.spines['left'].set_position('zero')
ax.spines['right'].set_color('none')
ax.spines['bottom'].set_position('zero')
ax.spines['top'].set_color('none')
plt.axis([-5,5,-5,5])
ax.xaxis.set_ticks_position('bottom')
ax.yaxis.set_ticks_position('left')
plt.grid()
plt.arrow(0,0, 3,1, head_width=0.2, color='r', length_includes_head=True, label='u')
plt.arrow(0,0, 1,3, head_width=0.2, color='r', length_includes_head=True, label='v')
plt.arrow(0,0, 4,4, head_width=0.2, color='r', length_includes_head=True, label='u+v')
ax.legend()

2
很容易忘记你有子图。谢谢这个。真的帮了我。 - preetam

25

您可以明确定义图例中的元素。

要完全控制哪些艺术家在图例中有条目,可以分别传递图例艺术家的可迭代对象和图例标签的可迭代对象。 参考

示例:

arr1 = plt.arrow(0,0, 3,1, head_width=0.2, color='r', length_includes_head=True)
arr2 = plt.arrow(0,0, 1,3, head_width=0.2, color='g', length_includes_head=True)
arr3 = plt.arrow(0,0, 4,4, head_width=0.2, color='b', length_includes_head=True)

plt.xlim(0,5)
plt.ylim(0,5)

plt.legend([arr1, arr2, arr3], ['u','v','u+v'])

输入图像描述


13
话虽如此,传说中的图例应该与plt.arrow()提供的标签一起工作,对吗? - Yehuda
@Yehuda 是的,plt.arrow() 的工作方式类似于 plt.plot(),这也是被要求的。奇怪的是为什么这个解决方案会得到这么多的赞,因为它并没有解释为什么 plt.legend() 不理解在 plt.arrow() 中设置标签的原因,尽管它应该理解。如果它的工作方式与 plt.plot() 相同,请参见 https://stackoverflow.com/questions/66862848/no-handles-with-labels-found-to-put-in-legend-error-after-plotting-two-plots-on 或 https://stackoverflow.com/questions/64555759/no-handles-with-labels-found-to-put-in-legend-linechart。 - questionto42
1
@questionto42 1. 感谢提供链接和答案。2. 这是唯一的答案,几乎有一年时间没有其他答案了,因此得到了赞同 ;) - Yehuda

8
错误是由于您未指定标签文本而引发的。
可以像这样进行操作:
plt.hist([x01, x02,x03], color=["lightcoral","lightskyblue","slategrey"], stacked=True, 
             label=['Supressed','Active','Resolved'])
plt.legend()

或者

如果您没有像以下错误的示例中指定标签文本,请不要使用plt.legend()

plt.hist([x01])
plt.legend()

以上内容会抛出相同的错误,因此要么删除图例函数,要么提供所需的内容->标签。

顺便说一句:这里的x01只是一个数字列表,我正在创建一个直方图,在第一个示例中,它们是三个数字列表,用于创建堆叠条形图。

总之,由于没有指定图例文本并调用/初始化图例,因此会引发此错误。


每个箭头都有一个指定的标签。 - Yehuda

5

在使用以下划线开头的标签时,我遇到了这个错误

plt.plot(x, y, label = '_bad_name')

从标签中删除下划线可以解决此问题


1
假设您有2个图形ax和ax2,我们可以:
  • 通过ax.get_label()获取每个y轴的标签
  • .legend允许摄入一个数组
fig.legend([ax.get_ylabel(), ax2.get_ylabel()], loc='upper right')

-1

我遇到了类似的问题,就像找不到标签来放在图例中。

首先,我的代码看起来像这样

figure, axis = pyplot.subplots(nrows=1,ncols=2, figsize=(15, 6), tight_layout=True)

axis[0].legend(title='Country', title_fontsize = 12) #this line
axis[0].pie(x=piechart_result['value_eur'],labels=piechart_result['short_name'])

axis[1].pie(x=piechart_result['value_eur'],labels=piechart_result['short_name')

pyplot.show()

然后我改成了

figure, axis = pyplot.subplots(nrows=1,ncols=2, figsize=(15, 6), tight_layout=True)

axis[0].pie(x=piechart_result['value_eur'],labels=piechart_result['short_name'])
axis[0].legend(title='Country', title_fontsize = 12) # this line 

axis[1].pie(x=piechart_result['value_eur'],labels=piechart_result['short_name')

pyplot.show()

这在我的Colab笔记本上运行良好


-1

我曾经遇到过同样的问题,并通过理解 .legend() 函数必须在处理标签属性的所有指令之后才能解决。这包括 pltax

所以将 ax.legend(*) 移动到最后一个命令。

希望这也能帮助到你。

更改

ax.plot(-trip_df.stop_lat, -trip_df.stop_lon, label = trip_id)
plt.legend()

ax.plot(-trip_df.stop_lat, -trip_df.stop_lon, label = trip_id)
ax.legend()
plt.legend()

网页内容由stack overflow 提供, 点击上面的
可以查看英文原文,
原文链接