无法在seaborn distplot中显示图例

51

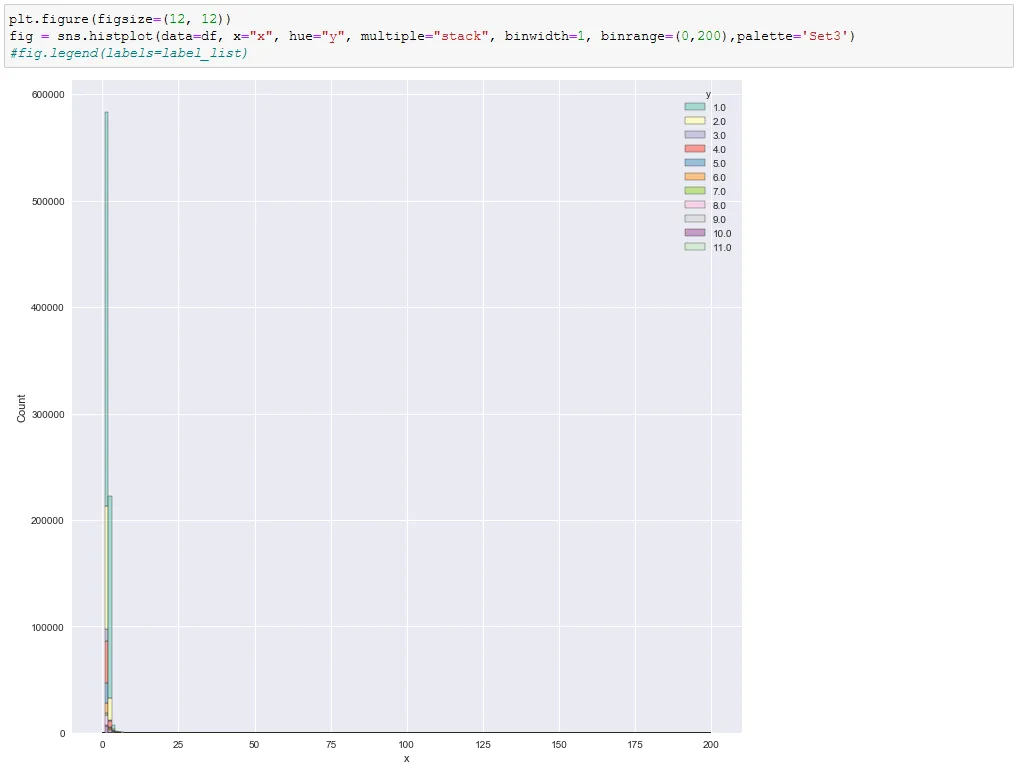
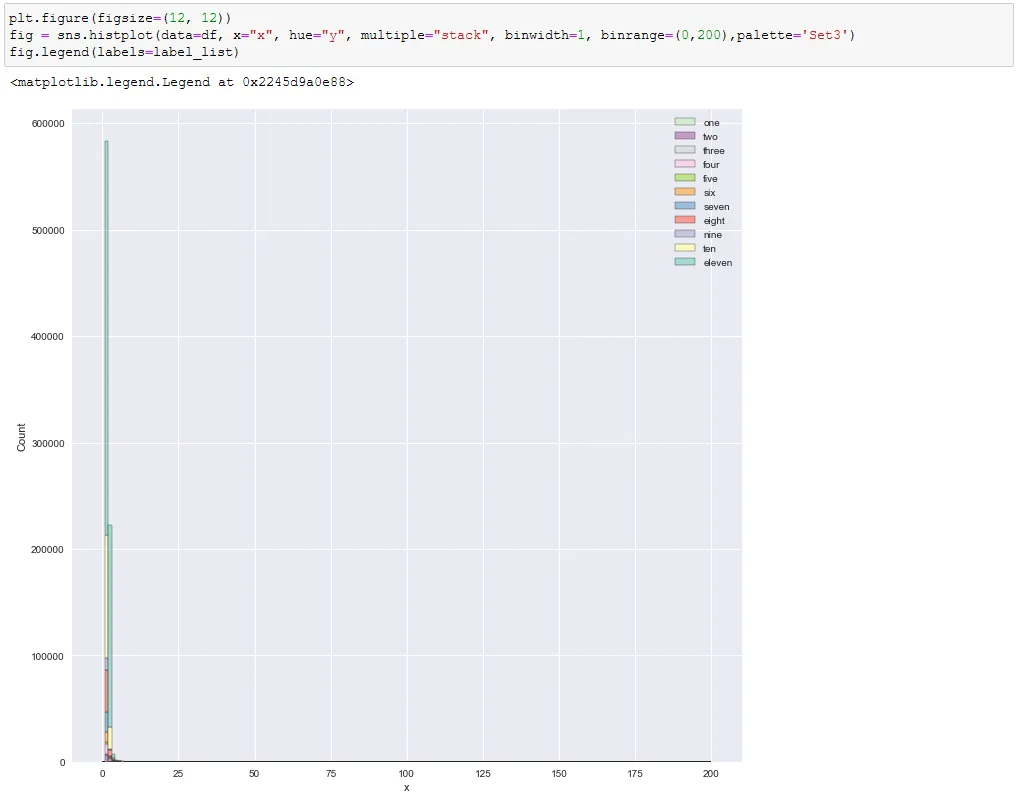
我是Python绘图的新手,正在尝试以下代码使用seaborn画分布图,但无法在图中看到图例,即test_label1test_label2

import matplotlib.pylab as plt
import seaborn as sns
import numpy as np

plt.figure("Test Plots")
lst1 = list(np.random.rand(10))
lst2 = list(np.random.rand(10))
sns.distplot(lst1, label='test_label1', color="0.25")
sns.distplot(lst2, label='test_label2', color="0.25")

plt.show()

4
图例。 - DavidG
感谢 @DavidG。 这个可以用,但唯一的问题是我必须最后单独处理它。所以类似 plt.legend(['test_label1', 'test_label2']) 的东西需要记住顺序。 - Rahul
2
你不必这样做,因为您已经在图中指定了 label=。在 plt.show() 之前调用 plt.legend() 就可以了(我这边是这样的)。 - DavidG
3个回答

79

如果你已经在 sns.distplot 中使用了label=来标注图表,则只需显示图例即可。方法是在plt.show()之前添加 plt.legend()

有关matplotlib图例的更多信息,请参阅文档


5
“Seaborn方式”真的是直接使用matplotlib来创建图例吗? - matanster
@matanster,我并没有看到任何问题,因为seaborn本质上只是matplotlib的一个包装器。有一些方法可以使用sns.distplot的参数来显示图例,但在我看来这并不简单。 - DavidG

11

通过使用fig.legend,我们可以在分布图中显示图例。 这里,一个labels数组的参数被传递给函数。 图例中的标签也将按照数组值的顺序显示。

import seaborn as sns
import matplotlib.pyplot as plt

fig = plt.figure(figsize=(10,6))
lst1 = list(np.random.rand(10))
lst2 = list(np.random.rand(10))
sns.distplot(lst1)
sns.distplot(lst1)
fig.legend(labels=['test_label1','test_label2'])
plt.show()

7
仅包含代码的答案被认为是低质量的帖子,请[编辑]您的答案并添加一些解释。 - barbsan

4

我在使用 "fig.legend()" 向 seaborn 直方图 的图例中添加标签时遇到了一些问题。它会颠倒图例中的颜色顺序,但不会更改直方图条形的颜色...

fig.legend(labels=['label1','label2',...])

使用fig.legend()之前的直方图

使用fig.legend()之后的直方图

模块版本:

  • seaborn '0.11.0'
  • matplotlib '3.1.3'

简单的解决方案是通过应用label_list.reverse()来反转的顺序。但我不认为这是一个好的解决方案。我不知道发生了什么事情,也不知道如何阻止反转图例中颜色的顺序。


网页内容由stack overflow 提供, 点击上面的
可以查看英文原文,
原文链接