我正在使用Seaborn的
我使用了函数文档中提到的'label'参数。
代码如下:
以下是输出内容,其中没有标签:
distplot()函数,将两个密度图并排绘制在同一张图上,并希望给它们加上标签。我使用了函数文档中提到的'label'参数。
代码如下:
Response4_mask = train_with_response['Response4'] == 1
not_Response4_mask = train_with_response['Response4'] != 1
plt.figure()
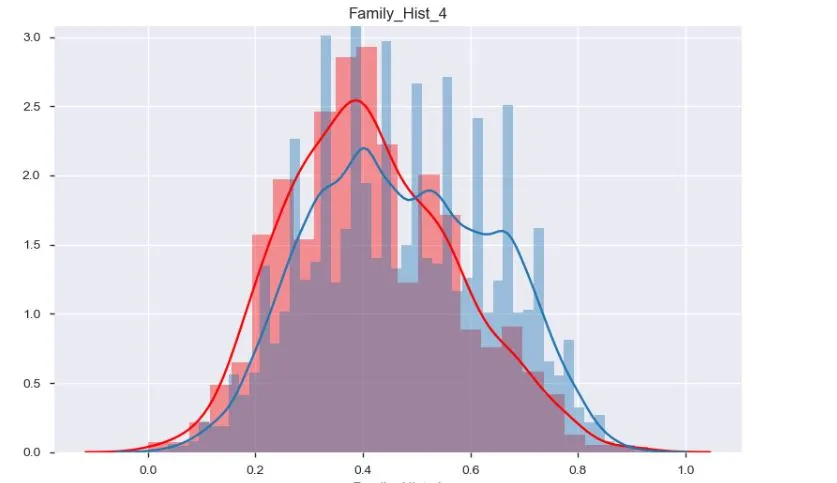
sns.distplot(a = train_imp_with_response[Response4_mask]['Family_Hist_4'], hist = True, color = 'red', label = 'Response4')
sns.distplot(a = train_imp_with_response[not_Response4_mask]['Family_Hist_4'], hist = True, label = 'not_Response4')
plt.title('Family_Hist_4')
plt.tight_layout()
plt.show()
以下是输出内容,其中没有标签: