我正在尝试使用以下代码绘制一些数据
from sklearn.datasets import make_blobs
import seaborn as sns
import numpy as np
X, y = make_blobs(n_samples=1000, n_features=2, centers=10, cluster_std=1.0, center_box=(-10.0, 10.0), shuffle=True, random_state=None)
palette = np.array(sns.color_palette("bright", 10)) #Chossing color
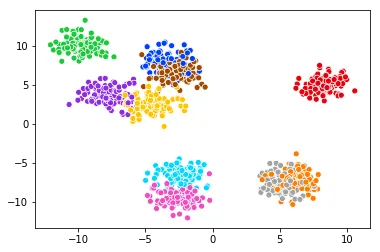
sns.scatterplot(X[:,0],X[:,1],legend='full',c=palette[y])
如何绘制图例。如果“brief”,则使用数字
hue和size变量...因此,似乎我还需要包括
hue参数。
但是当我尝试在以下代码中使用hue参数时,会创建以下图形...sns.scatterplot(X[:,0],X[:,1],legend='full',hue=y,c=palette[y])
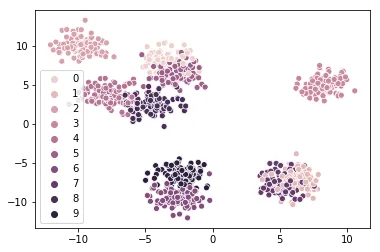
hue参数后,似乎覆盖了调色板参数。无论我选择什么调色板,颜色仍然很丑陋...我的问题是:如何在保持所需颜色的同时显示图例?
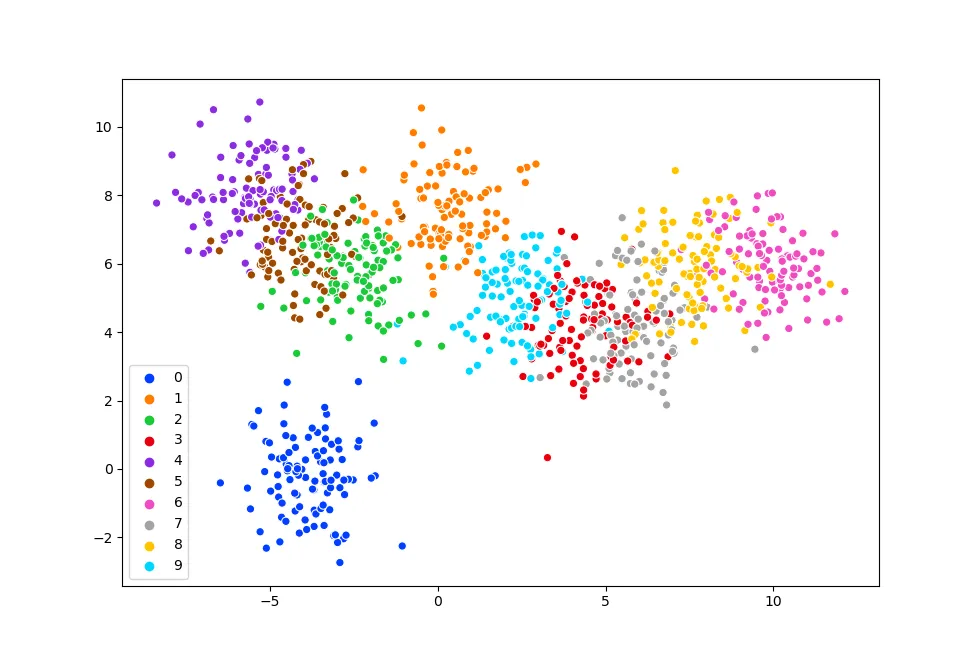
ckwarg 和 seaborn 的palettekwarg?现在它可以工作了,谢谢。 - Raven Cheuk