我将一个列表的列表传递给tsplot(假设每个列表中有31个项目),它显示0到31的x轴标签。
如何使它显示-15到15而不是0到31?
如果需要,可以参考教程中的示例:
import numpy as np
np.random.seed(9221999)
import pandas as pd
from scipy import stats, optimize
import matplotlib.pyplot as plt
import seaborn as sns
sns.set(palette="Set2")

def sine_wave(n_x, obs_err_sd=1.5, tp_err_sd=.3):
    x = np.linspace(0, (n_x - 1) / 2, n_x)
    y = np.sin(x) + np.random.normal(0, obs_err_sd) + np.random.normal(0, tp_err_sd, n_x)
    return y

sines = np.array([sine_wave(31) for _ in range(20)])
sns.tsplot(sines);
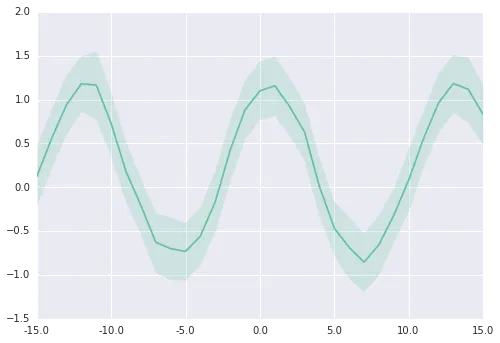
tsplot函数的time参数,是的,没错。 - mwaskom