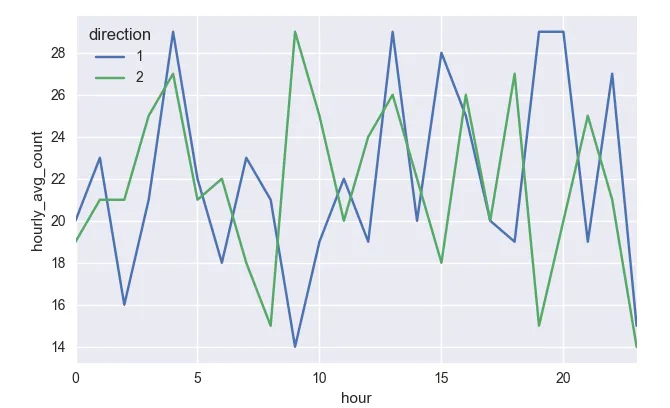
我希望使用matplotlib和seaborn创建平滑的折线图。
这是我的数据框df:
hour    direction    hourly_avg_count
0       1            20
1       1            22
2       1            21
3       1            21
..      ...          ...
24      1            15
0       2            24
1       2            28
...     ...          ...
折线图应该包含两条线,一条用于
direction 等于 1,另一条用于 direction 等于 2。X 轴是 hour,Y 轴是 hourly_avg_count。
我尝试过这个,但是我看不到这些线。import pandas as pd
import seaborn as sns
import matplotlib
import matplotlib.pyplot as plt
plt.figure(figsize=(12,8))
sns.tsplot(df, time='hour', condition='direction', value='hourly_avg_count')
tsplot,pandas 绘图方法就足够了。 - mwaskom