旋转x轴标签FacetGrid seaborn无效

10

我正在尝试使用Python中的Seaborn创建一个面板图,但是我遇到了一些问题,其中一个问题是旋转x轴标签。

我目前正在尝试使用以下代码:

import pandas as pd
import seaborn as sns
import matplotlib.pyplot as plt 

vin = pd.Series(["W1","W1","W2","W2","W1","W3","W4"])
word1 = pd.Series(['pdi','pdi','tread','adjust','fill','pdi','fill'])
word2 = pd.Series(['perform','perform','fill','measure','tire','check','tire'])
date = pd.Series(["01-07-2020","01-07-2020","01-07-2020","01-07-2020","01-08-2020","01-08-2020","01-08-2020"])

bigram_with_dates = pd.concat([vin,word1,word2,date], axis = 1)
names = ["vin", "word1","word2","date"]
bigram_with_dates.columns = names
bigram_with_dates['date'] = pd.to_datetime(bigram_with_dates['date'])
bigram_with_dates['text_concat'] = bigram_with_dates['word1'] + "," + bigram_with_dates['word2']

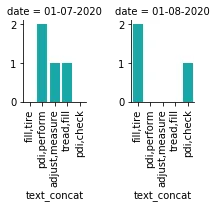
plot_params = sns.FacetGrid(bigram_with_dates, col="date", height=3, aspect=.5, col_wrap = 10,sharex = False, sharey = False)
plot = plot_params.map(sns.countplot, 'text_concat', color = 'c', order = bigram_with_dates['text_concat'])
plot_adjust = plot.fig.subplots_adjust(wspace=0.5, hspace=0.5)

for axes in plot.axes.flat:
    axes.set_xticklabels(axes.get_xticklabels(), rotation=90)

我使用这个时出现了一个错误,错误信息如下:

AttributeError: 'NoneType' object has no attribute 'axes'

我认为它的意思是没有返回对象,所以在空对象上设置轴不会有任何作用。

这段代码在其他SO帖子中似乎有效,但我似乎无法让它正常工作。

如果您有任何关于我做错了什么的建议,将不胜感激。

谢谢, Curtis


g是什么?不应该是plot吗? - Nicolas Gervais
@NicolasGervais 没错,抱歉我已经在我的帖子中进行了编辑,但代码仍然存在相同的问题。 - Curtis
1
代码看起来没问题。我认为你的问题只是你没有一个 [mcve],因此用变量名搞混了自己。 - ImportanceOfBeingErnest
@ImportanceOfBeingErnest 我已经编辑了帖子,现在应该可以再现了。我已经创建了数据集并指定了所需的模块。我仍然收到相同的错误消息。 - Curtis
抱歉,这与行长度无关。这是创建(并可能未存储)的对象数量与此类链接的问题。这只是自我伤害的最佳方式之一,而如果您每行只创建一个对象,您将直接看到您分配错误变量的位置。 - ImportanceOfBeingErnest
显示剩余2条评论
1个回答

14
尝试这样做,看起来你正在覆盖'plot'变量。:

尝试这样做,看起来你正在覆盖'plot'变量。

import pandas as pd
import seaborn as sns
import matplotlib.pyplot as plt 
%matplotlib inline

vin = pd.Series(["W1","W1","W2","W2","W1","W3","W4"])
word1 = pd.Series(['pdi','pdi','tread','adjust','fill','pdi','fill'])
word2 = pd.Series(['perform','perform','fill','measure','tire','check','tire'])
date = pd.Series(["01-07-2020","01-07-2020","01-07-2020","01-07-2020","01-08-2020","01-08-2020","01-08-2020"])

bigram_with_dates = pd.concat([vin,word1,word2,date], axis = 1)
names = ["vin", "word1","word2","date"]
bigram_with_dates.columns = names
bigram_with_dates['date'] = pd.to_datetime(bigram_with_dates['date']).dt.strftime('%m-%d-%Y')
bigram_with_dates['text_concat'] = bigram_with_dates['word1'] + "," + bigram_with_dates['word2']

plot = sns.FacetGrid(bigram_with_dates, col="date", height=3, aspect=.5, col_wrap = 10,sharex = False, sharey = False)
plot1 = plot.map(sns.countplot, 
                 'text_concat', 
                 color = 'c', 
                 order = bigram_with_dates['text_concat'].value_counts(ascending = False).iloc[:5].index)\
            .fig.subplots_adjust(wspace=0.5, hspace=12)

for axes in plot.axes.flat:
    _ = axes.set_xticklabels(axes.get_xticklabels(), rotation=90)
plt.tight_layout()

输出:

在此输入图片描述


谢谢您的帮助,非常感激。这似乎对我有用! - Curtis
我还有一个问题,就是在我的图表中,我希望标签能够随着不同的分面而改变。由于字段“text_concat”中有50多个类别,但每个图表中的标签都相同。我是否还遗漏了其他内容?我认为“order”参数应该可以解决这个问题。 - Curtis

网页内容由stack overflow 提供, 点击上面的
可以查看英文原文,
原文链接