我想在seaborn FacetGrid图中格式化y轴标签,包括小数位数和/或一些文本。
受启发于 如何将 seaborn/matplotlib 轴标记格式从数字转换为千位或百万位?(125,436 变成 125.4K)
下面的错误提示信息如下:
import seaborn as sns
import matplotlib.pyplot as plt
sns.set(style="ticks")
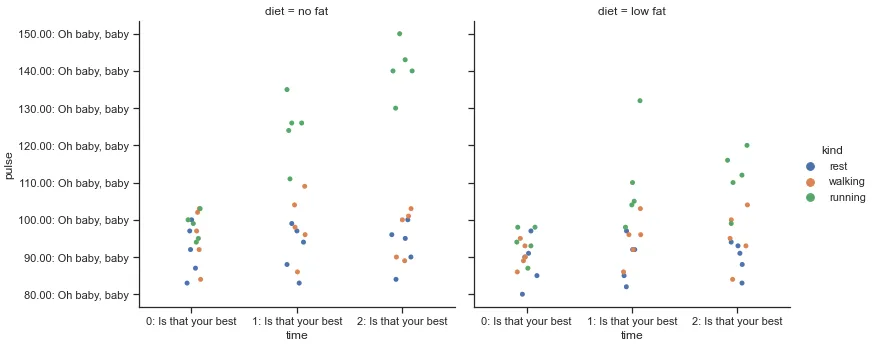
exercise = sns.load_dataset("exercise")
g = sns.catplot(x="time", y="pulse", hue="kind", col="diet", data=exercise)
#g.xaxis.set_major_formatter(ticker.FuncFormatter(lambda x, pos: '{:,.2f}'.format(x) + 'K'))
#g.set(xticks=['a','try',0.5])
g.yaxis.set_major_formatter(ticker.FuncFormatter(lambda x, pos: '{:,.2f}'.format(x) + 'K'))
plt.show()
受启发于 如何将 seaborn/matplotlib 轴标记格式从数字转换为千位或百万位?(125,436 变成 125.4K)
ax.xaxis.set_major_formatter(ticker.FuncFormatter(lambda x, pos: '{:,.2f}'.format(x) + 'K'))
下面的错误提示信息如下:
AttributeError: 'FacetGrid'对象没有属性'xaxis'