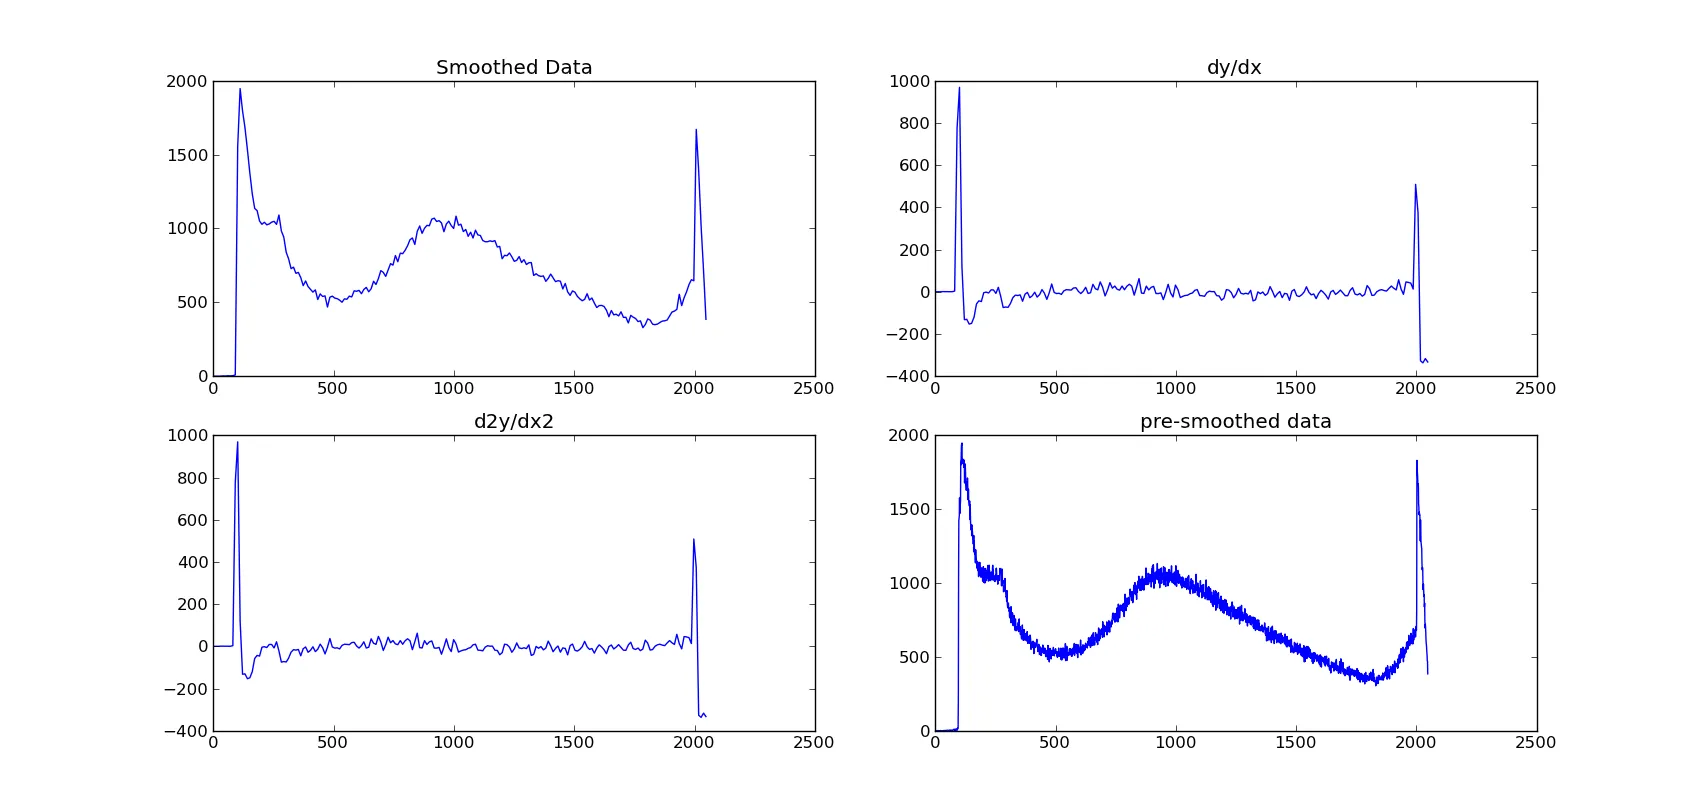
我有一个宇宙射线探测器的能谱。这个谱遵循指数曲线,但其中会有宽广(可能非常轻微)的波峰。显然,数据包含一定程度的噪音。
我试图平滑数据并绘制其梯度。目前我一直在使用scipy sline函数来平滑数据,然后使用np.gradient()函数来计算梯度。
正如您从图片中所看到的那样,梯度函数的方法是找出每个点之间的差异,并且它没有清晰地显示出波峰。
基本上,我需要一个平滑的梯度图。任何帮助都将非常惊人!
我已经尝试了两种样条方法:
def smooth_data(y,x,factor):
    print "smoothing data by interpolation..."
    xnew=np.linspace(min(x),max(x),factor*len(x))
    smoothy=spline(x,y,xnew)
    return smoothy,xnew

def smooth2_data(y,x,factor):
    xnew=np.linspace(min(x),max(x),factor*len(x))
    f=interpolate.UnivariateSpline(x,y)
    g=interpolate.interp1d(x,y)
    return g(xnew),xnew
编辑:尝试了数值微分:
def smooth_data(y,x,factor):
    print "smoothing data by interpolation..."
    xnew=np.linspace(min(x),max(x),factor*len(x))
    smoothy=spline(x,y,xnew)
    return smoothy,xnew

def minim(u,f,k):
    """"functional to be minimised to find optimum u. f is original, u is approx"""
    integral1=abs(np.gradient(u))
    part1=simps(integral1)
    part2=simps(u)
    integral2=abs(part2-f)**2.
    part3=simps(integral2)
    F=k*part1+part3
    return F


def fit(data_x,data_y,denoising,smooth_fac):
    smy,xnew=smooth_data(data_y,data_x,smooth_fac)
    y0,xnnew=smooth_data(smy,xnew,1./smooth_fac)
    y0=list(y0)
    data_y=list(data_y)
    data_fit=fmin(minim, y0, args=(data_y,denoising), maxiter=1000, maxfun=1000)
    return data_fit
然而,它只是再次返回相同的图形!