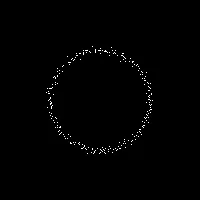
我正在尝试从类似于示例中的圆形嘈杂数据中估算/插值曲线。我的数据包括不止一个圆,但这是解决其他结构问题的好起点。
我有一张嘈杂的二进制图像,并尝试将连续曲线/骨架拟合到上面(每个像素都有2个邻居,除非形状不是圆形时可能有起始和结束像素)。我在分别拟合x、y坐标方面取得了一些成功,使用距离起始点的距离作为x值和坐标作为y值,然后在小步长中插值距离。然后,我检查坐标是否全部连接。在某些极端情况下,新插值点未连接,我必须对插值采用更小的步长。这经常导致像素具有多个邻居和其他奇怪的伪影。
有没有更简单的方法将这些值拟合成曲线,并得到连续曲线作为结果?
我有一张嘈杂的二进制图像,并尝试将连续曲线/骨架拟合到上面(每个像素都有2个邻居,除非形状不是圆形时可能有起始和结束像素)。我在分别拟合x、y坐标方面取得了一些成功,使用距离起始点的距离作为x值和坐标作为y值,然后在小步长中插值距离。然后,我检查坐标是否全部连接。在某些极端情况下,新插值点未连接,我必须对插值采用更小的步长。这经常导致像素具有多个邻居和其他奇怪的伪影。
有没有更简单的方法将这些值拟合成曲线,并得到连续曲线作为结果?
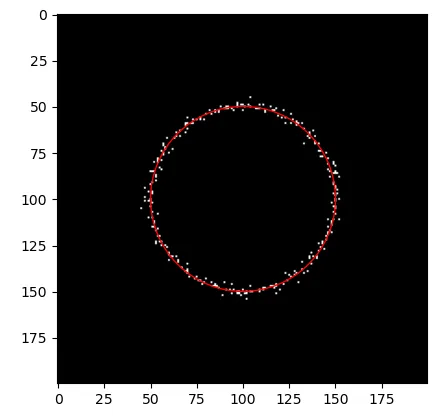
import numpy as np
from skimage import draw
from matplotlib import pyplot as plt
image = np.zeros((200,200), dtype=np.uint8)

coords = np.array(draw.circle_perimeter(100,100,50))

noise = np.random.normal(0,2,coords.shape).astype(np.int64)

coords += noise
image[coords[0], coords[1]] = 1

plt.imshow(image, cmap="gray")

plt.show()