我有一组x和y坐标,它是一个曲线/形状,我想要平滑曲线/形状并绘制图形。
我尝试了不同的插值方法来平滑曲线/形状,但仍然无法达到我的期望。使用点来绘制平滑的曲线/形状。
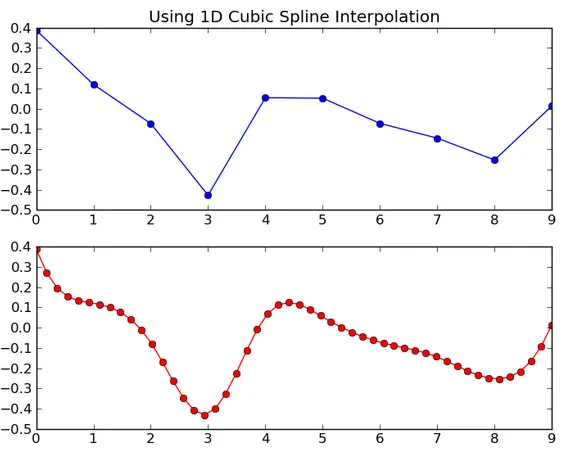
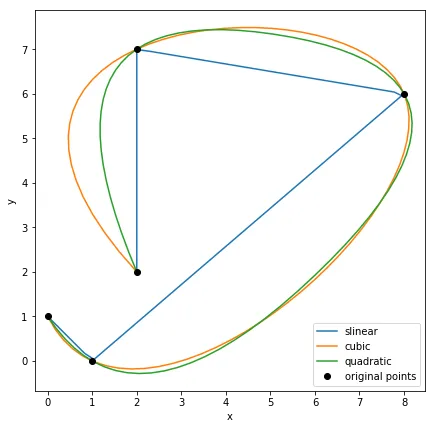
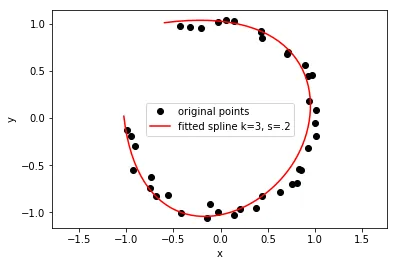
像下面这样,使用x、y点来获取平滑的圆/曲线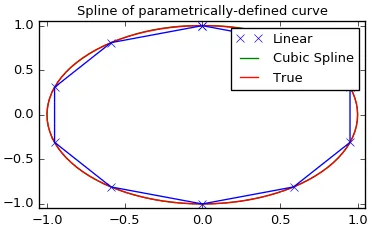
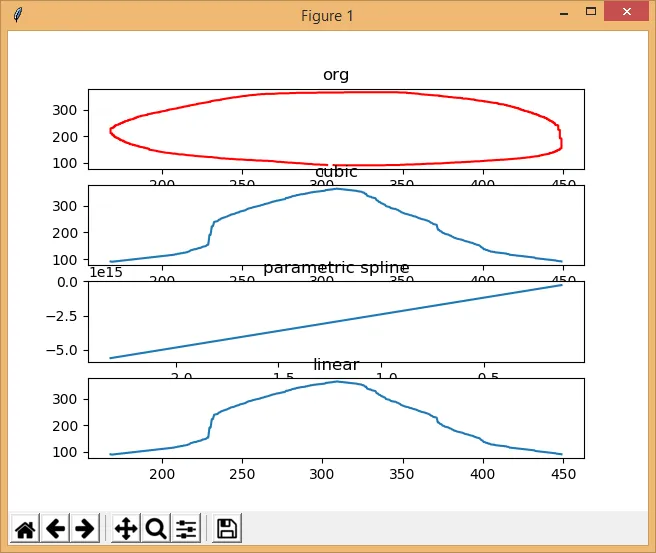
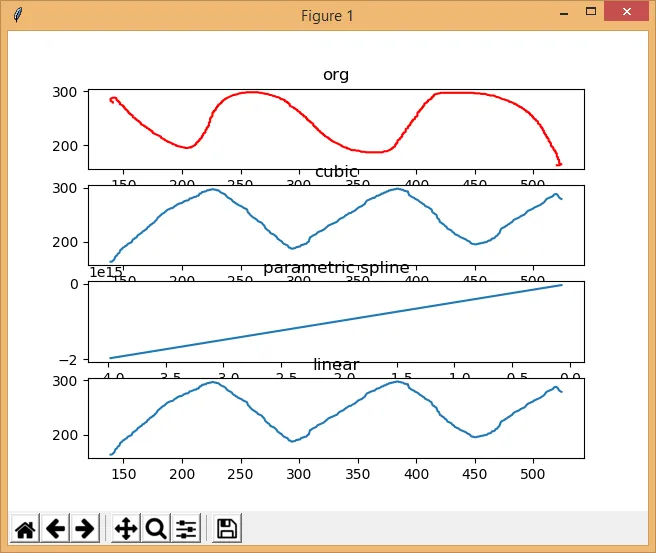
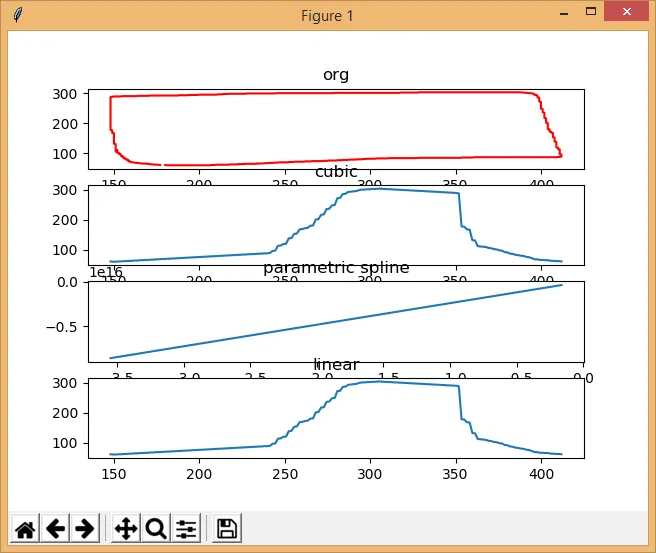
 然而,我得到了如下结果:
对于cubic_spline_interpolation,我得到了以下错误信息:
ValueError: Error on input data
对于univariate_spline_interpolated,我得到了以下错误信息:
ValueError: x must be strictly increasing
对于rbf,我得到了以下错误信息:
numpy.linalg.linalg.LinAlgError: Matrix is singular.
我不知道如何修复它们并获得正确的尖锐和曲线。非常感谢您的帮助。
编辑: 对于那些无法下载源代码和x、y坐标文件的人,我在问题中发布了代码和x、y坐标。
我尝试了不同的插值方法来平滑曲线/形状,但仍然无法达到我的期望。使用点来绘制平滑的曲线/形状。
像下面这样,使用x、y点来获取平滑的圆/曲线
然而,我得到了如下结果:
circle.jpg
curve.jpg
square.jpg
对于cubic_spline_interpolation,我得到了以下错误信息:
ValueError: Error on input data
对于univariate_spline_interpolated,我得到了以下错误信息:
ValueError: x must be strictly increasing
对于rbf,我得到了以下错误信息:
numpy.linalg.linalg.LinAlgError: Matrix is singular.
我不知道如何修复它们并获得正确的尖锐和曲线。非常感谢您的帮助。
编辑: 对于那些无法下载源代码和x、y坐标文件的人,我在问题中发布了代码和x、y坐标。
#!/usr/bin/env python3
from std_lib import *

import os
import numpy as np
import cv2

from scipy import interpolate
import matplotlib.pyplot as plt

CUR_DIR = os.getcwd()
CIRCLE_FILE = "circle.txt"
CURVE_FILE  = "curve.txt"
SQUARE_FILE = "square.txt"

#test
CIRCLE_NAME = "circle"
CURVE_NAME  = "curve"
SQUARE_NAME = "square"

SYS_TOKEN_CNT = 2   # x, y

total_pt_cnt = 0        # total no. of points
x_arr = np.array([])    # x position set
y_arr = np.array([])    # y position set

def convert_coord_to_array(file_path):
    global total_pt_cnt
    global x_arr
    global y_arr

    if file_path == "":
        return FALSE

    with open(file_path) as f:
        content = f.readlines()

    content = [x.strip() for x in content]

    total_pt_cnt = len(content)

    if (total_pt_cnt <= 0):
        return FALSE

    ##
    x_arr = np.empty((0, total_pt_cnt))
    y_arr = np.empty((0, total_pt_cnt))

    #compare the first and last x
    # if ((content[0][0]) > (content[-1])):
        # is_reverse = TRUE

    for x in content:
        token_cnt = get_token_cnt(x, ',')

        if (token_cnt != SYS_TOKEN_CNT):
            return FALSE

        for idx in range(token_cnt):
            token_string = get_token_string(x, ',', idx)
            token_string = token_string.strip()
            if (not token_string.isdigit()):
                return FALSE

            # save x, y set
            if (idx == 0):
                x_arr = np.append(x_arr, int(token_string))
            else:
                y_arr = np.append(y_arr, int(token_string))

    return TRUE

def linear_interpolation(fig, axs):
    xnew = np.linspace(x_arr.min(), x_arr.max(), len(x_arr))
    f = interpolate.interp1d(xnew , y_arr)

    axs.plot(xnew, f(xnew))
    axs.set_title('linear')

def cubic_interpolation(fig, axs):
    xnew = np.linspace(x_arr.min(), x_arr.max(), len(x_arr))
    f = interpolate.interp1d(xnew , y_arr, kind='cubic')

    axs.plot(xnew, f(xnew))
    axs.set_title('cubic')

def cubic_spline_interpolation(fig, axs):
    xnew = np.linspace(x_arr.min(), x_arr.max(), len(x_arr))
    tck = interpolate.splrep(x_arr, y_arr, s=0) #always fail (ValueError: Error on input data)
    ynew = interpolate.splev(xnew, tck, der=0)

    axs.plot(xnew, ynew)
    axs.set_title('cubic spline')

def parametric_spline_interpolation(fig, axs):
    xnew = np.linspace(x_arr.min(), x_arr.max(), len(x_arr))
    tck, u = interpolate.splprep([x_arr, y_arr], s=0)
    out = interpolate.splev(xnew, tck)

    axs.plot(out[0], out[1])
    axs.set_title('parametric spline')

def univariate_spline_interpolated(fig, axs):
    s = interpolate.InterpolatedUnivariateSpline(x_arr, y_arr)# ValueError: x must be strictly increasing
    xnew = np.linspace(x_arr.min(), x_arr.max(), len(x_arr))
    ynew = s(xnew)

    axs.plot(xnew, ynew)
    axs.set_title('univariate spline')

def rbf(fig, axs):
    xnew = np.linspace(x_arr.min(), x_arr.max(), len(x_arr))
    rbf = interpolate.Rbf(x_arr, y_arr) # numpy.linalg.linalg.LinAlgError: Matrix is singular.
    fi = rbf(xnew)

    axs.plot(xnew, fi)
    axs.set_title('rbf')

def interpolation():
    fig, axs = plt.subplots(nrows=4)
    axs[0].plot(x_arr, y_arr, 'r-')
    axs[0].set_title('org')

    cubic_interpolation(fig, axs[1])
    # cubic_spline_interpolation(fig, axs[2])
    parametric_spline_interpolation(fig, axs[2])
    # univariate_spline_interpolated(fig, axs[3])
    # rbf(fig, axs[3])
    linear_interpolation(fig, axs[3])

    plt.show()

#------- main -------
if __name__ == "__main__":
    # np.seterr(divide='ignore', invalid='ignore')

    file_name = CUR_DIR + "/" + CIRCLE_FILE
    convert_coord_to_array(file_name)
    #file_name = CUR_DIR + "/" + CURVE_FILE
    #convert_coord_to_array(file_name)
    #file_name = CUR_DIR + "/" + SQUARE_FILE
    #convert_coord_to_array(file_name)
    #
    interpolation()
圆形的x,y坐标
307, 91
308, 90
339, 90
340, 91
348, 91
349, 92
351, 92
352, 93
357, 93
358, 94
361, 94
362, 95
364, 95
365, 96
369, 96
370, 97
374, 97
375, 98
376, 98
377, 99
379, 99
380, 100
382, 100
383, 101
386, 101
387, 102
389, 102
390, 103
392, 103
393, 104
394, 104
395, 105
398, 105
399, 106
400, 106
401, 107
402, 107
403, 108
405, 108
406, 109
407, 109
408, 110
410, 110
411, 111
413, 111
414, 112
415, 112
416, 113
417, 113
418, 114
419, 114
420, 115
421, 115
422, 116
423, 116
425, 118
426, 118
428, 120
429, 120
430, 121
430, 122
431, 122
433, 124
434, 124
435, 125
435, 126
437, 128
437, 129
441, 133
441, 134
442, 135
442, 137
443, 137
444, 138
444, 140
445, 141
445, 142
446, 143
446, 146
447, 147
447, 148
448, 149
448, 153
449, 154
449, 191
448, 192
448, 223
447, 224
447, 240
446, 241
446, 242
445, 243
445, 248
444, 249
444, 253
443, 254
443, 256
442, 257
442, 259
441, 260
441, 263
440, 264
440, 267
439, 268
439, 269
438, 270
438, 272
436, 274
436, 275
435, 276
435, 279
434, 280
434, 281
433, 282
433, 283
431, 285
431, 288
429, 290
429, 291
428, 292
428, 293
426, 295
426, 296
425, 297
425, 298
424, 299
424, 300
423, 301
423, 303
422, 304
422, 305
420, 307
420, 308
419, 309
419, 310
417, 312
417, 313
415, 315
415, 316
414, 317
414, 318
412, 320
411, 320
410, 321
410, 322
409, 323
409, 324
408, 325
407, 325
402, 330
401, 330
401, 331
399, 333
398, 333
395, 336
395, 337
394, 338
393, 338
390, 341
388, 341
387, 342
387, 343
386, 344
384, 344
383, 345
382, 345
380, 347
379, 347
377, 349
376, 349
374, 351
373, 351
373, 352
372, 353
370, 353
369, 354
368, 354
367, 355
366, 355
365, 356
364, 356
363, 357
362, 357
359, 360
358, 360
357, 361
356, 361
355, 362
353, 362
353, 363
352, 364
348, 364
347, 365
314, 365
313, 364
297, 364
296, 363
284, 363
283, 362
280, 362
279, 361
273, 361
272, 360
271, 360
270, 359
265, 359
264, 358
262, 358
261, 357
260, 357
258, 355
257, 355
256, 354
255, 354
252, 351
251, 351
246, 346
245, 346
237, 338
237, 337
235, 335
234, 335
231, 332
231, 331
230, 330
230, 329
222, 321
222, 320
217, 315
217, 314
213, 310
213, 309
210, 306
210, 305
204, 299
204, 298
203, 297
203, 296
199, 292
199, 291
198, 290
198, 289
197, 289
194, 286
194, 285
191, 282
191, 280
187, 276
187, 275
185, 273
185, 271
184, 270
184, 269
183, 268
183, 266
182, 265
182, 264
180, 262
180, 261
179, 260
179, 258
177, 256
177, 254
176, 253
176, 251
175, 250
175, 249
174, 248
174, 246
173, 245
173, 243
171, 241
171, 237
170, 236
170, 232
169, 231
169, 230
168, 229
168, 211
169, 210
169, 205
170, 204
170, 199
171, 198
171, 195
172, 194
172, 193
173, 192
173, 189
174, 188
174, 185
176, 183
176, 180
177, 179
177, 177
178, 176
178, 175
179, 174
179, 173
180, 172
180, 170
182, 168
182, 167
183, 166
183, 165
185, 163
185, 162
186, 161
186, 160
189, 157
189, 156
191, 154
191, 153
192, 152
192, 149
197, 144
197, 143
203, 137
204, 137
207, 134
208, 134
211, 131
213, 131
216, 128
217, 128
218, 127
219, 127
221, 125
222, 125
223, 124
224, 124
225, 123
226, 123
227, 122
228, 122
229, 121
231, 121
233, 119
234, 119
237, 116
239, 116
240, 115
241, 115
242, 114
244, 114
245, 113
246, 113
247, 112
250, 112
251, 111
252, 111
253, 110
256, 110
257, 109
258, 109
259, 108
262, 108
263, 107
266, 107
267, 106
269, 106
272, 103
274, 103
275, 102
276, 102
277, 101
278, 101
279, 100
281, 100
282, 99
283, 99
284, 98
286, 98
287, 97
288, 97
289, 96
290, 96
291, 95
293, 95
295, 93
298, 93
299, 92
302, 92
303, 91
已解决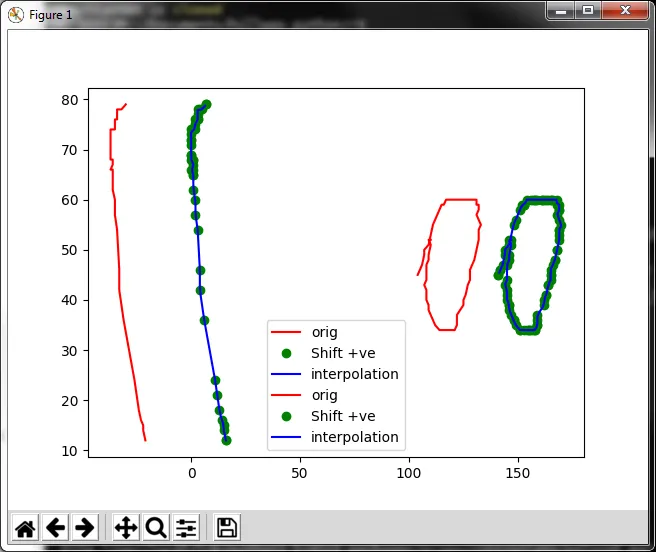
def linear_interpolateion(self, x, y):

        points = np.array([x, y]).T  # a (nbre_points x nbre_dim) array

        # Linear length along the line:
        distance = np.cumsum( np.sqrt(np.sum( np.diff(points, axis=0)**2, axis=1 )) )
        distance = np.insert(distance, 0, 0)

        alpha = np.linspace(distance.min(), int(distance.max()), len(x))
        interpolator =  interpolate.interp1d(distance, points, kind='slinear', axis=0)
        interpolated_points = interpolator(alpha)

        out_x = interpolated_points.T[0]
        out_y = interpolated_points.T[1]

        return out_x, out_y
x.min()和x.max()在原始数据上表示什么?我认为最小值和最大值在原始数据和插值点上必须完全相同。只有“内部”曲线上的点被添加... - xdze2